SPECpower_ssj2008
Host 'm915-5' Performance Report
Copyright © 2007-2011 Standard Performance Evaluation Corporation
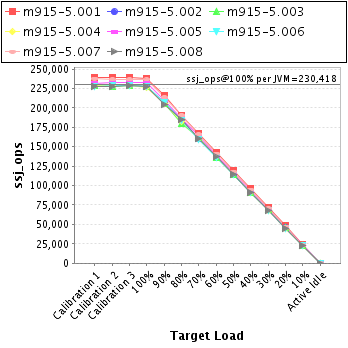
| Dell Inc. PowerEdge M915 | ssj_ops@100% = 1,843,342 ssj_ops@100% per JVM = 230,418 |
||||
| Test Sponsor: | Dell Inc. | SPEC License #: | 55 | Test Method: | Multi Node |
| Tested By: | Dell Inc. | Test Location: | Round Rock, TX, USA | Test Date: | Jun 28, 2011 |
| Hardware Availability: | Jun-2011 | Software Availability: | Feb-2011 | Publication: | Aug 2, 2011 |
| System Source: | Single Supplier | System Designation: | Server | Power Provisioning: | Line-powered |
| Target Load | Actual Load | ssj_ops | |
|---|---|---|---|
| Target | Actual | ||
| Calibration 1 | 1,852,239 | ||
| Calibration 2 | 1,850,954 | ||
| Calibration 3 | 1,853,108 | ||
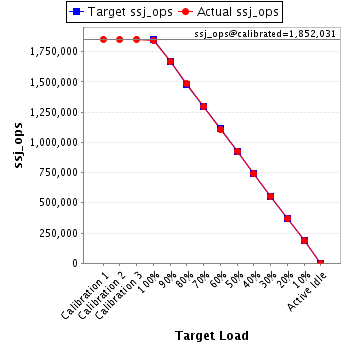
| ssj_ops@calibrated=1,852,031 | |||
| 100% | 99.5% | 1,852,031 | 1,843,342 |
| 90% | 90.1% | 1,666,828 | 1,668,090 |
| 80% | 80.1% | 1,481,625 | 1,482,866 |
| 70% | 70.2% | 1,296,422 | 1,299,673 |
| 60% | 59.7% | 1,111,219 | 1,105,767 |
| 50% | 50.1% | 926,015 | 926,982 |
| 40% | 39.9% | 740,812 | 739,488 |
| 30% | 29.9% | 555,609 | 554,326 |
| 20% | 19.9% | 370,406 | 368,936 |
| 10% | 10.0% | 185,203 | 184,337 |
| Active Idle | 0 | 0 | |
| Set Identifier: | sut |
| Set Description: | PowerEdge M915 |
| # of Identical Nodes: | 8 |
| Comment: | None |
| Hardware | |
|---|---|
| Hardware Vendor: | Dell Inc. |
| Model: | PowerEdge M915 |
| Form Factor: | Blade |
| CPU Name: | AMD Opteron 6176 (2.30 GHz) |
| CPU Characteristics: | 12 Core, 2.30 GHz, 12 MB L3 Cache |
| CPU Frequency (MHz): | 2300 |
| CPU(s) Enabled: | 48 cores, 4 chips, 12 cores/chip |
| Hardware Threads: | 48 (1 / core) |
| CPU(s) Orderable: | 2,4 chips |
| Primary Cache: | 64 KB I + 64 KB D on chip per core |
| Secondary Cache: | 512 KB I+D on chip per core |
| Tertiary Cache: | 12 MB I+D on chip per chip, 6MB shared / 6 cores |
| Other Cache: | None |
| Memory Amount (GB): | 32 |
| # and size of DIMM: | 16 x 2048 MB |
| Memory Details: | 2GB 1Rx8 PC3L-10600R ECC RDIMM, Slots A1-A4, B1-B4, C1-C4, D1-D4 populated |
| Power Supply Quantity and Rating (W): | None |
| Power Supply Details: | N/A |
| Disk Drive: | 1 x 50 GB 2.5" SSD P/N X2N7H |
| Disk Controller: | PERC H200 Modular |
| # and type of Network Interface Cards (NICs) Installed: | 2 x onboard dual-port 1 Gigabit Ethernet |
| NICs Enabled in Firmware / OS / Connected: | 2/2/1 |
| Network Speed (Mbit): | 1000 |
| Keyboard: | None |
| Mouse: | None |
| Monitor: | None |
| Optical Drives: | No |
| Other Hardware: | None |
| Software | |
|---|---|
| Power Management: | Balanced Mode in OS (See Notes) |
| Operating System (OS): | Windows 2008 Server Enterprise x64 Edition |
| OS Version: | R2 SP1 |
| Filesystem: | NTFS |
| JVM Vendor: | IBM Corporation |
| JVM Version: | IBM J9 VM (build 2.4, J2RE 1.6.0 IBM J9 2.4 Windows Server 2008 amd64-64 jvmwa64 60sr5-20090519_35743 (JIT enabled, AOT enabled) |
| JVM Command-line Options: | -Xaggressive -Xcompressedrefs -Xgcpolicy:gencon -Xmn1400m -Xms1875m -Xmx1875m -XlockReservation -Xnoloa -XtlhPrefetch -Xlp |
| JVM Affinity: | start /affinity [3F, FC0, 3F000, FC0000, 3F000000, FC0000000, 3F000000000, FC0000000000] |
| JVM Instances: | 8 |
| JVM Initial Heap (MB): | 1875 |
| JVM Maximum Heap (MB): | 1875 |
| JVM Address Bits: | 64 |
| Boot Firmware Version: | 1.0.3 |
| Management Firmware Version: | iDRAC 3.21 build 48 |
| Workload Version: | SSJ 1.2.6 |
| Director Location: | Controller |
| Other Software: | IBM WebSphere Application Server |
| JVM Instance | ssj_ops@100% |
|---|---|
| m915-5.001 | 238,137 |
| m915-5.002 | 227,390 |
| m915-5.003 | 227,884 |
| m915-5.004 | 226,834 |
| m915-5.005 | 232,057 |
| m915-5.006 | 227,628 |
| m915-5.007 | 236,523 |
| m915-5.008 | 226,890 |
| ssj_ops@100% | 1,843,342 |
| ssj_ops@100% per JVM | 230,418 |
| Target Load | Actual Load | ssj_ops | |
|---|---|---|---|
| Target | Actual | ||
| Calibration 1 | 239,397 | ||
| Calibration 2 | 239,346 | ||
| Calibration 3 | 239,471 | ||
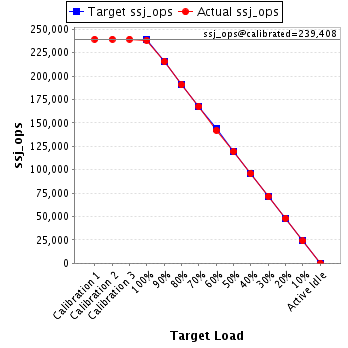
| ssj_ops@calibrated=239,408 | |||
| 100% | 99.5% | 239,408 | 238,137 |
| 90% | 90.0% | 215,468 | 215,562 |
| 80% | 79.6% | 191,527 | 190,581 |
| 70% | 70.0% | 167,586 | 167,518 |
| 60% | 59.3% | 143,645 | 142,050 |
| 50% | 49.9% | 119,704 | 119,417 |
| 40% | 40.0% | 95,763 | 95,762 |
| 30% | 29.9% | 71,823 | 71,618 |
| 20% | 20.1% | 47,882 | 48,132 |
| 10% | 10.0% | 23,941 | 23,830 |
| Active Idle | 0 | 0 | |
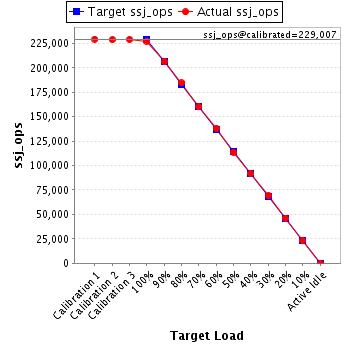
| Target Load | Actual Load | ssj_ops | |
|---|---|---|---|
| Target | Actual | ||
| Calibration 1 | 229,378 | ||
| Calibration 2 | 228,825 | ||
| Calibration 3 | 229,190 | ||
| ssj_ops@calibrated=229,007 | |||
| 100% | 99.3% | 229,007 | 227,390 |
| 90% | 90.1% | 206,107 | 206,438 |
| 80% | 80.6% | 183,206 | 184,513 |
| 70% | 69.9% | 160,305 | 160,086 |
| 60% | 60.3% | 137,404 | 138,011 |
| 50% | 49.7% | 114,504 | 113,810 |
| 40% | 40.0% | 91,603 | 91,614 |
| 30% | 30.2% | 68,702 | 69,159 |
| 20% | 20.2% | 45,801 | 46,233 |
| 10% | 10.1% | 22,901 | 23,060 |
| Active Idle | 0 | 0 | |
| Target Load | Actual Load | ssj_ops | |
|---|---|---|---|
| Target | Actual | ||
| Calibration 1 | 228,587 | ||
| Calibration 2 | 227,995 | ||
| Calibration 3 | 229,029 | ||
| ssj_ops@calibrated=228,512 | |||
| 100% | 99.7% | 228,512 | 227,884 |
| 90% | 90.1% | 205,661 | 205,782 |
| 80% | 78.9% | 182,810 | 180,322 |
| 70% | 70.6% | 159,958 | 161,380 |
| 60% | 59.7% | 137,107 | 136,396 |
| 50% | 50.3% | 114,256 | 114,878 |
| 40% | 39.8% | 91,405 | 90,866 |
| 30% | 30.0% | 68,554 | 68,567 |
| 20% | 20.1% | 45,702 | 45,849 |
| 10% | 9.9% | 22,851 | 22,610 |
| Active Idle | 0 | 0 | |

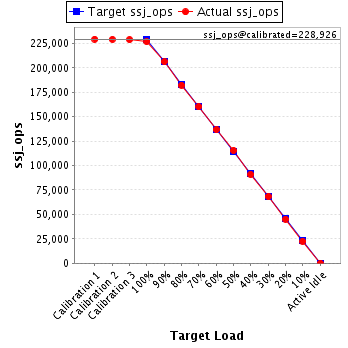
| Target Load | Actual Load | ssj_ops | |
|---|---|---|---|
| Target | Actual | ||
| Calibration 1 | 229,350 | ||
| Calibration 2 | 229,131 | ||
| Calibration 3 | 228,721 | ||
| ssj_ops@calibrated=228,926 | |||
| 100% | 99.1% | 228,926 | 226,834 |
| 90% | 90.1% | 206,033 | 206,190 |
| 80% | 79.6% | 183,141 | 182,318 |
| 70% | 70.0% | 160,248 | 160,141 |
| 60% | 59.8% | 137,356 | 136,831 |
| 50% | 50.5% | 114,463 | 115,537 |
| 40% | 39.7% | 91,570 | 90,781 |
| 30% | 29.9% | 68,678 | 68,385 |
| 20% | 19.7% | 45,785 | 45,205 |
| 10% | 9.8% | 22,893 | 22,473 |
| Active Idle | 0 | 0 | |
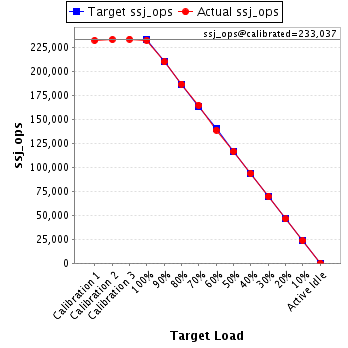
| Target Load | Actual Load | ssj_ops | |
|---|---|---|---|
| Target | Actual | ||
| Calibration 1 | 231,932 | ||
| Calibration 2 | 232,824 | ||
| Calibration 3 | 233,249 | ||
| ssj_ops@calibrated=233,037 | |||
| 100% | 99.6% | 233,037 | 232,057 |
| 90% | 89.9% | 209,733 | 209,586 |
| 80% | 80.0% | 186,429 | 186,535 |
| 70% | 70.6% | 163,126 | 164,506 |
| 60% | 59.5% | 139,822 | 138,615 |
| 50% | 49.9% | 116,518 | 116,295 |
| 40% | 40.0% | 93,215 | 93,272 |
| 30% | 29.9% | 69,911 | 69,639 |
| 20% | 19.8% | 46,607 | 46,107 |
| 10% | 10.1% | 23,304 | 23,623 |
| Active Idle | 0 | 0 | |
| Target Load | Actual Load | ssj_ops | |
|---|---|---|---|
| Target | Actual | ||
| Calibration 1 | 227,854 | ||
| Calibration 2 | 228,207 | ||
| Calibration 3 | 228,346 | ||
| ssj_ops@calibrated=228,276 | |||
| 100% | 99.7% | 228,276 | 227,628 |
| 90% | 90.5% | 205,449 | 206,482 |
| 80% | 80.3% | 182,621 | 183,248 |
| 70% | 70.0% | 159,794 | 159,827 |
| 60% | 59.5% | 136,966 | 135,803 |
| 50% | 50.1% | 114,138 | 114,290 |
| 40% | 39.8% | 91,311 | 90,832 |
| 30% | 29.8% | 68,483 | 67,973 |
| 20% | 19.7% | 45,655 | 45,023 |
| 10% | 10.0% | 22,828 | 22,751 |
| Active Idle | 0 | 0 | |

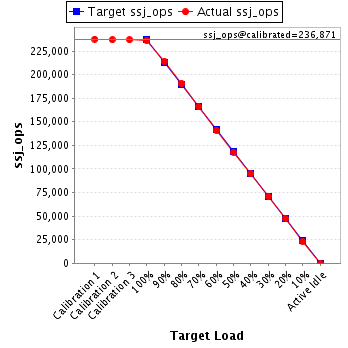
| Target Load | Actual Load | ssj_ops | |
|---|---|---|---|
| Target | Actual | ||
| Calibration 1 | 237,631 | ||
| Calibration 2 | 236,904 | ||
| Calibration 3 | 236,838 | ||
| ssj_ops@calibrated=236,871 | |||
| 100% | 99.9% | 236,871 | 236,523 |
| 90% | 90.3% | 213,184 | 213,952 |
| 80% | 80.5% | 189,497 | 190,679 |
| 70% | 70.1% | 165,810 | 166,161 |
| 60% | 59.6% | 142,122 | 141,214 |
| 50% | 49.8% | 118,435 | 117,944 |
| 40% | 40.1% | 94,748 | 94,916 |
| 30% | 30.0% | 71,061 | 71,107 |
| 20% | 20.0% | 47,374 | 47,277 |
| 10% | 9.8% | 23,687 | 23,164 |
| Active Idle | 0 | 0 | |
| Target Load | Actual Load | ssj_ops | |
|---|---|---|---|
| Target | Actual | ||
| Calibration 1 | 228,109 | ||
| Calibration 2 | 227,723 | ||
| Calibration 3 | 228,264 | ||
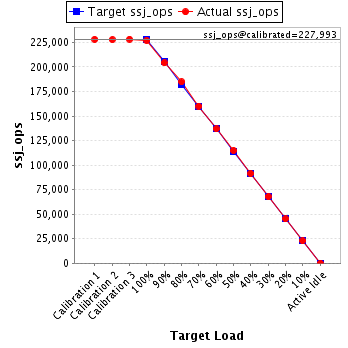
| ssj_ops@calibrated=227,993 | |||
| 100% | 99.5% | 227,993 | 226,890 |
| 90% | 89.5% | 205,194 | 204,099 |
| 80% | 81.0% | 182,395 | 184,670 |
| 70% | 70.2% | 159,595 | 160,056 |
| 60% | 60.0% | 136,796 | 136,845 |
| 50% | 50.4% | 113,997 | 114,811 |
| 40% | 40.1% | 91,197 | 91,445 |
| 30% | 29.8% | 68,398 | 67,878 |
| 20% | 19.8% | 45,599 | 45,111 |
| 10% | 10.0% | 22,799 | 22,826 |
| Active Idle | 0 | 0 | |