
SPECpower_ssj2008
Host 'm915-6' Performance Report
Copyright © 2007-2011 Standard Performance Evaluation Corporation
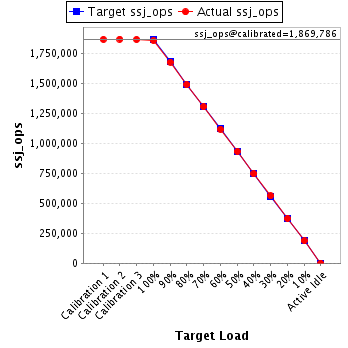
| Dell Inc. PowerEdge M915 | ssj_ops@100% = 1,859,882 ssj_ops@100% per JVM = 232,485 |
||||
| Test Sponsor: | Dell Inc. | SPEC License #: | 55 | Test Method: | Multi Node |
| Tested By: | Dell Inc. | Test Location: | Round Rock, TX, USA | Test Date: | Jun 28, 2011 |
| Hardware Availability: | Jun-2011 | Software Availability: | Feb-2011 | Publication: | Aug 2, 2011 |
| System Source: | Single Supplier | System Designation: | Server | Power Provisioning: | Line-powered |
| Target Load | Actual Load | ssj_ops | |
|---|---|---|---|
| Target | Actual | ||
| Calibration 1 | 1,868,868 | ||
| Calibration 2 | 1,870,999 | ||
| Calibration 3 | 1,868,574 | ||
| ssj_ops@calibrated=1,869,786 | |||
| 100% | 99.5% | 1,869,786 | 1,859,882 |
| 90% | 89.8% | 1,682,808 | 1,679,623 |
| 80% | 79.8% | 1,495,829 | 1,491,749 |
| 70% | 69.9% | 1,308,850 | 1,306,749 |
| 60% | 59.9% | 1,121,872 | 1,120,376 |
| 50% | 49.9% | 934,893 | 933,905 |
| 40% | 39.9% | 747,914 | 746,674 |
| 30% | 30.1% | 560,936 | 561,921 |
| 20% | 20.0% | 373,957 | 373,582 |
| 10% | 10.0% | 186,979 | 187,575 |
| Active Idle | 0 | 0 | |
| Set Identifier: | sut |
| Set Description: | PowerEdge M915 |
| # of Identical Nodes: | 8 |
| Comment: | None |
| Hardware | |
|---|---|
| Hardware Vendor: | Dell Inc. |
| Model: | PowerEdge M915 |
| Form Factor: | Blade |
| CPU Name: | AMD Opteron 6176 (2.30 GHz) |
| CPU Characteristics: | 12 Core, 2.30 GHz, 12 MB L3 Cache |
| CPU Frequency (MHz): | 2300 |
| CPU(s) Enabled: | 48 cores, 4 chips, 12 cores/chip |
| Hardware Threads: | 48 (1 / core) |
| CPU(s) Orderable: | 2,4 chips |
| Primary Cache: | 64 KB I + 64 KB D on chip per core |
| Secondary Cache: | 512 KB I+D on chip per core |
| Tertiary Cache: | 12 MB I+D on chip per chip, 6MB shared / 6 cores |
| Other Cache: | None |
| Memory Amount (GB): | 32 |
| # and size of DIMM: | 16 x 2048 MB |
| Memory Details: | 2GB 1Rx8 PC3L-10600R ECC RDIMM, Slots A1-A4, B1-B4, C1-C4, D1-D4 populated |
| Power Supply Quantity and Rating (W): | None |
| Power Supply Details: | N/A |
| Disk Drive: | 1 x 50 GB 2.5" SSD P/N X2N7H |
| Disk Controller: | PERC H200 Modular |
| # and type of Network Interface Cards (NICs) Installed: | 2 x onboard dual-port 1 Gigabit Ethernet |
| NICs Enabled in Firmware / OS / Connected: | 2/2/1 |
| Network Speed (Mbit): | 1000 |
| Keyboard: | None |
| Mouse: | None |
| Monitor: | None |
| Optical Drives: | No |
| Other Hardware: | None |
| Software | |
|---|---|
| Power Management: | Balanced Mode in OS (See Notes) |
| Operating System (OS): | Windows 2008 Server Enterprise x64 Edition |
| OS Version: | R2 SP1 |
| Filesystem: | NTFS |
| JVM Vendor: | IBM Corporation |
| JVM Version: | IBM J9 VM (build 2.4, J2RE 1.6.0 IBM J9 2.4 Windows Server 2008 amd64-64 jvmwa64 60sr5-20090519_35743 (JIT enabled, AOT enabled) |
| JVM Command-line Options: | -Xaggressive -Xcompressedrefs -Xgcpolicy:gencon -Xmn1400m -Xms1875m -Xmx1875m -XlockReservation -Xnoloa -XtlhPrefetch -Xlp |
| JVM Affinity: | start /affinity [3F, FC0, 3F000, FC0000, 3F000000, FC0000000, 3F000000000, FC0000000000] |
| JVM Instances: | 8 |
| JVM Initial Heap (MB): | 1875 |
| JVM Maximum Heap (MB): | 1875 |
| JVM Address Bits: | 64 |
| Boot Firmware Version: | 1.0.3 |
| Management Firmware Version: | iDRAC 3.21 build 48 |
| Workload Version: | SSJ 1.2.6 |
| Director Location: | Controller |
| Other Software: | IBM WebSphere Application Server |
| JVM Instance | ssj_ops@100% |
|---|---|
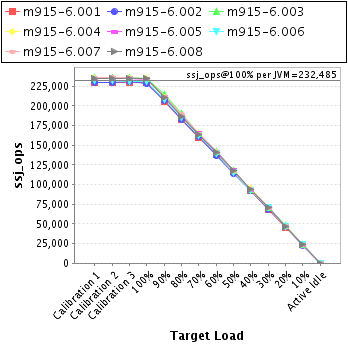
| m915-6.001 | 229,147 |
| m915-6.002 | 228,089 |
| m915-6.003 | 234,418 |
| m915-6.004 | 234,612 |
| m915-6.005 | 234,027 |
| m915-6.006 | 231,192 |
| m915-6.007 | 233,792 |
| m915-6.008 | 234,605 |
| ssj_ops@100% | 1,859,882 |
| ssj_ops@100% per JVM | 232,485 |
| Target Load | Actual Load | ssj_ops | |
|---|---|---|---|
| Target | Actual | ||
| Calibration 1 | 229,505 | ||
| Calibration 2 | 229,945 | ||
| Calibration 3 | 230,022 | ||
| ssj_ops@calibrated=229,984 | |||
| 100% | 99.6% | 229,984 | 229,147 |
| 90% | 89.6% | 206,985 | 206,146 |
| 80% | 79.5% | 183,987 | 182,863 |
| 70% | 69.5% | 160,988 | 159,849 |
| 60% | 60.3% | 137,990 | 138,701 |
| 50% | 50.6% | 114,992 | 116,400 |
| 40% | 40.1% | 91,993 | 92,140 |
| 30% | 29.9% | 68,995 | 68,857 |
| 20% | 19.9% | 45,997 | 45,772 |
| 10% | 10.1% | 22,998 | 23,216 |
| Active Idle | 0 | 0 | |

| Target Load | Actual Load | ssj_ops | |
|---|---|---|---|
| Target | Actual | ||
| Calibration 1 | 230,318 | ||
| Calibration 2 | 229,580 | ||
| Calibration 3 | 230,508 | ||
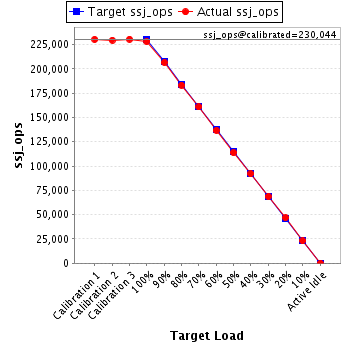
| ssj_ops@calibrated=230,044 | |||
| 100% | 99.2% | 230,044 | 228,089 |
| 90% | 89.8% | 207,039 | 206,525 |
| 80% | 79.6% | 184,035 | 183,228 |
| 70% | 69.9% | 161,031 | 160,770 |
| 60% | 59.4% | 138,026 | 136,649 |
| 50% | 49.4% | 115,022 | 113,733 |
| 40% | 40.0% | 92,018 | 91,944 |
| 30% | 29.9% | 69,013 | 68,682 |
| 20% | 20.3% | 46,009 | 46,703 |
| 10% | 10.0% | 23,004 | 23,047 |
| Active Idle | 0 | 0 | |
| Target Load | Actual Load | ssj_ops | |
|---|---|---|---|
| Target | Actual | ||
| Calibration 1 | 236,324 | ||
| Calibration 2 | 236,098 | ||
| Calibration 3 | 236,131 | ||
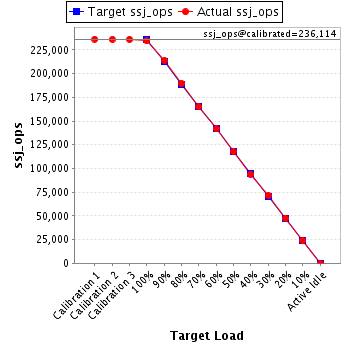
| ssj_ops@calibrated=236,114 | |||
| 100% | 99.3% | 236,114 | 234,418 |
| 90% | 90.6% | 212,503 | 213,867 |
| 80% | 80.4% | 188,892 | 189,727 |
| 70% | 69.8% | 165,280 | 164,922 |
| 60% | 60.1% | 141,669 | 141,848 |
| 50% | 49.9% | 118,057 | 117,855 |
| 40% | 39.8% | 94,446 | 94,075 |
| 30% | 30.3% | 70,834 | 71,472 |
| 20% | 20.1% | 47,223 | 47,467 |
| 10% | 10.2% | 23,611 | 23,992 |
| Active Idle | 0 | 0 | |
| Target Load | Actual Load | ssj_ops | |
|---|---|---|---|
| Target | Actual | ||
| Calibration 1 | 235,047 | ||
| Calibration 2 | 235,204 | ||
| Calibration 3 | 235,174 | ||
| ssj_ops@calibrated=235,189 | |||
| 100% | 99.8% | 235,189 | 234,612 |
| 90% | 89.8% | 211,670 | 211,246 |
| 80% | 79.6% | 188,151 | 187,227 |
| 70% | 70.1% | 164,632 | 164,844 |
| 60% | 59.6% | 141,113 | 140,189 |
| 50% | 49.8% | 117,595 | 117,218 |
| 40% | 40.2% | 94,076 | 94,516 |
| 30% | 30.0% | 70,557 | 70,633 |
| 20% | 19.9% | 47,038 | 46,701 |
| 10% | 10.0% | 23,519 | 23,453 |
| Active Idle | 0 | 0 | |

| Target Load | Actual Load | ssj_ops | |
|---|---|---|---|
| Target | Actual | ||
| Calibration 1 | 234,767 | ||
| Calibration 2 | 235,754 | ||
| Calibration 3 | 235,156 | ||
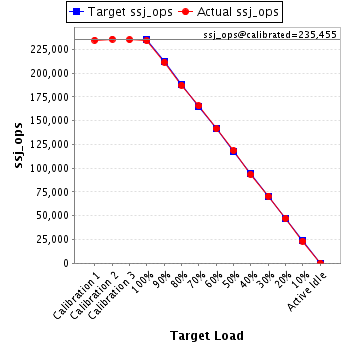
| ssj_ops@calibrated=235,455 | |||
| 100% | 99.4% | 235,455 | 234,027 |
| 90% | 89.9% | 211,909 | 211,665 |
| 80% | 79.5% | 188,364 | 187,249 |
| 70% | 70.3% | 164,818 | 165,497 |
| 60% | 60.2% | 141,273 | 141,679 |
| 50% | 50.3% | 117,727 | 118,467 |
| 40% | 39.7% | 94,182 | 93,366 |
| 30% | 30.0% | 70,636 | 70,655 |
| 20% | 20.1% | 47,091 | 47,241 |
| 10% | 9.9% | 23,545 | 23,333 |
| Active Idle | 0 | 0 | |
| Target Load | Actual Load | ssj_ops | |
|---|---|---|---|
| Target | Actual | ||
| Calibration 1 | 232,483 | ||
| Calibration 2 | 232,792 | ||
| Calibration 3 | 231,264 | ||
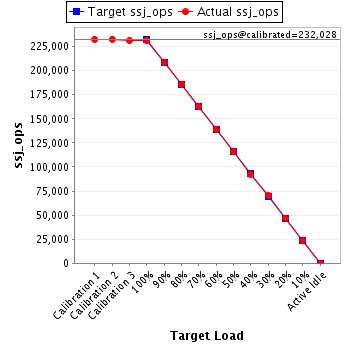
| ssj_ops@calibrated=232,028 | |||
| 100% | 99.6% | 232,028 | 231,192 |
| 90% | 89.9% | 208,825 | 208,496 |
| 80% | 80.1% | 185,622 | 185,841 |
| 70% | 70.2% | 162,419 | 162,797 |
| 60% | 59.9% | 139,217 | 138,918 |
| 50% | 49.9% | 116,014 | 115,821 |
| 40% | 39.8% | 92,811 | 92,277 |
| 30% | 30.4% | 69,608 | 70,640 |
| 20% | 20.0% | 46,406 | 46,376 |
| 10% | 10.1% | 23,203 | 23,379 |
| Active Idle | 0 | 0 | |
| Target Load | Actual Load | ssj_ops | |
|---|---|---|---|
| Target | Actual | ||
| Calibration 1 | 235,862 | ||
| Calibration 2 | 236,456 | ||
| Calibration 3 | 235,479 | ||
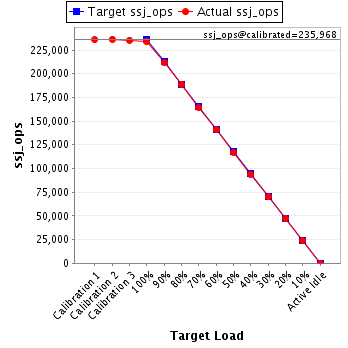
| ssj_ops@calibrated=235,968 | |||
| 100% | 99.1% | 235,968 | 233,792 |
| 90% | 89.7% | 212,371 | 211,580 |
| 80% | 80.1% | 188,774 | 189,084 |
| 70% | 69.7% | 165,177 | 164,507 |
| 60% | 59.8% | 141,581 | 141,034 |
| 50% | 49.6% | 117,984 | 116,978 |
| 40% | 39.9% | 94,387 | 94,116 |
| 30% | 29.7% | 70,790 | 70,131 |
| 20% | 19.8% | 47,194 | 46,768 |
| 10% | 10.0% | 23,597 | 23,685 |
| Active Idle | 0 | 0 | |
| Target Load | Actual Load | ssj_ops | |
|---|---|---|---|
| Target | Actual | ||
| Calibration 1 | 234,562 | ||
| Calibration 2 | 235,171 | ||
| Calibration 3 | 234,839 | ||
| ssj_ops@calibrated=235,005 | |||
| 100% | 99.8% | 235,005 | 234,605 |
| 90% | 89.4% | 211,505 | 210,096 |
| 80% | 79.4% | 188,004 | 186,530 |
| 70% | 69.6% | 164,504 | 163,562 |
| 60% | 60.2% | 141,003 | 141,359 |
| 50% | 50.0% | 117,503 | 117,432 |
| 40% | 40.1% | 94,002 | 94,239 |
| 30% | 30.1% | 70,502 | 70,850 |
| 20% | 19.8% | 47,001 | 46,553 |
| 10% | 10.0% | 23,501 | 23,470 |
| Active Idle | 0 | 0 | |
