
SPECpower_ssj2008
Host 'm915-7' Performance Report
Copyright © 2007-2011 Standard Performance Evaluation Corporation
| Dell Inc. PowerEdge M915 | ssj_ops@100% = 1,853,310 ssj_ops@100% per JVM = 231,664 |
||||
| Test Sponsor: | Dell Inc. | SPEC License #: | 55 | Test Method: | Multi Node |
| Tested By: | Dell Inc. | Test Location: | Round Rock, TX, USA | Test Date: | Jun 28, 2011 |
| Hardware Availability: | Jun-2011 | Software Availability: | Feb-2011 | Publication: | Aug 2, 2011 |
| System Source: | Single Supplier | System Designation: | Server | Power Provisioning: | Line-powered |
| Target Load | Actual Load | ssj_ops | |
|---|---|---|---|
| Target | Actual | ||
| Calibration 1 | 1,860,243 | ||
| Calibration 2 | 1,859,864 | ||
| Calibration 3 | 1,859,992 | ||
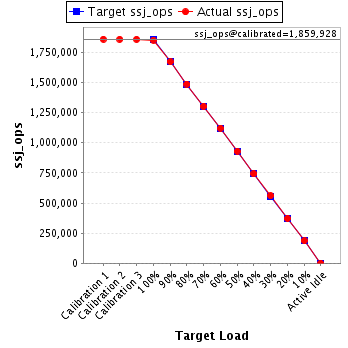
| ssj_ops@calibrated=1,859,928 | |||
| 100% | 99.6% | 1,859,928 | 1,853,310 |
| 90% | 89.9% | 1,673,936 | 1,672,433 |
| 80% | 80.0% | 1,487,943 | 1,488,022 |
| 70% | 70.2% | 1,301,950 | 1,304,803 |
| 60% | 60.4% | 1,115,957 | 1,122,722 |
| 50% | 50.0% | 929,964 | 930,884 |
| 40% | 39.9% | 743,971 | 741,590 |
| 30% | 30.1% | 557,979 | 560,172 |
| 20% | 20.0% | 371,986 | 372,581 |
| 10% | 10.1% | 185,993 | 187,005 |
| Active Idle | 0 | 0 | |
| Set Identifier: | sut |
| Set Description: | PowerEdge M915 |
| # of Identical Nodes: | 8 |
| Comment: | None |
| Hardware | |
|---|---|
| Hardware Vendor: | Dell Inc. |
| Model: | PowerEdge M915 |
| Form Factor: | Blade |
| CPU Name: | AMD Opteron 6176 (2.30 GHz) |
| CPU Characteristics: | 12 Core, 2.30 GHz, 12 MB L3 Cache |
| CPU Frequency (MHz): | 2300 |
| CPU(s) Enabled: | 48 cores, 4 chips, 12 cores/chip |
| Hardware Threads: | 48 (1 / core) |
| CPU(s) Orderable: | 2,4 chips |
| Primary Cache: | 64 KB I + 64 KB D on chip per core |
| Secondary Cache: | 512 KB I+D on chip per core |
| Tertiary Cache: | 12 MB I+D on chip per chip, 6MB shared / 6 cores |
| Other Cache: | None |
| Memory Amount (GB): | 32 |
| # and size of DIMM: | 16 x 2048 MB |
| Memory Details: | 2GB 1Rx8 PC3L-10600R ECC RDIMM, Slots A1-A4, B1-B4, C1-C4, D1-D4 populated |
| Power Supply Quantity and Rating (W): | None |
| Power Supply Details: | N/A |
| Disk Drive: | 1 x 50 GB 2.5" SSD P/N X2N7H |
| Disk Controller: | PERC H200 Modular |
| # and type of Network Interface Cards (NICs) Installed: | 2 x onboard dual-port 1 Gigabit Ethernet |
| NICs Enabled in Firmware / OS / Connected: | 2/2/1 |
| Network Speed (Mbit): | 1000 |
| Keyboard: | None |
| Mouse: | None |
| Monitor: | None |
| Optical Drives: | No |
| Other Hardware: | None |
| Software | |
|---|---|
| Power Management: | Balanced Mode in OS (See Notes) |
| Operating System (OS): | Windows 2008 Server Enterprise x64 Edition |
| OS Version: | R2 SP1 |
| Filesystem: | NTFS |
| JVM Vendor: | IBM Corporation |
| JVM Version: | IBM J9 VM (build 2.4, J2RE 1.6.0 IBM J9 2.4 Windows Server 2008 amd64-64 jvmwa64 60sr5-20090519_35743 (JIT enabled, AOT enabled) |
| JVM Command-line Options: | -Xaggressive -Xcompressedrefs -Xgcpolicy:gencon -Xmn1400m -Xms1875m -Xmx1875m -XlockReservation -Xnoloa -XtlhPrefetch -Xlp |
| JVM Affinity: | start /affinity [3F, FC0, 3F000, FC0000, 3F000000, FC0000000, 3F000000000, FC0000000000] |
| JVM Instances: | 8 |
| JVM Initial Heap (MB): | 1875 |
| JVM Maximum Heap (MB): | 1875 |
| JVM Address Bits: | 64 |
| Boot Firmware Version: | 1.0.3 |
| Management Firmware Version: | iDRAC 3.21 build 48 |
| Workload Version: | SSJ 1.2.6 |
| Director Location: | Controller |
| Other Software: | IBM WebSphere Application Server |
| JVM Instance | ssj_ops@100% |
|---|---|
| m915-7.001 | 228,281 |
| m915-7.002 | 233,427 |
| m915-7.003 | 229,537 |
| m915-7.004 | 232,915 |
| m915-7.005 | 232,913 |
| m915-7.006 | 229,738 |
| m915-7.007 | 231,309 |
| m915-7.008 | 235,190 |
| ssj_ops@100% | 1,853,310 |
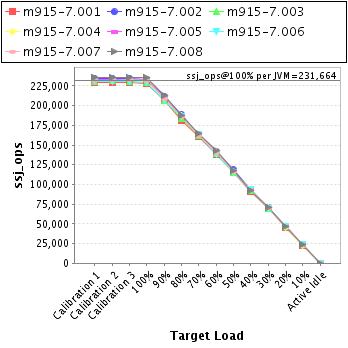
| ssj_ops@100% per JVM | 231,664 |
| Target Load | Actual Load | ssj_ops | |
|---|---|---|---|
| Target | Actual | ||
| Calibration 1 | 229,506 | ||
| Calibration 2 | 229,213 | ||
| Calibration 3 | 229,433 | ||
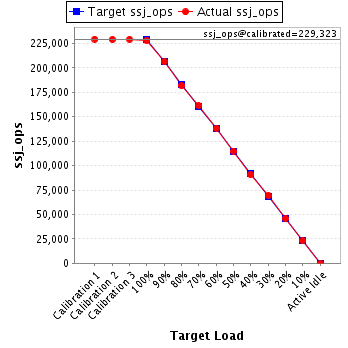
| ssj_ops@calibrated=229,323 | |||
| 100% | 99.5% | 229,323 | 228,281 |
| 90% | 90.1% | 206,391 | 206,549 |
| 80% | 79.2% | 183,458 | 181,725 |
| 70% | 70.3% | 160,526 | 161,302 |
| 60% | 60.3% | 137,594 | 138,327 |
| 50% | 50.1% | 114,662 | 114,915 |
| 40% | 39.6% | 91,729 | 90,911 |
| 30% | 30.1% | 68,797 | 69,130 |
| 20% | 20.0% | 45,865 | 45,890 |
| 10% | 10.0% | 22,932 | 22,889 |
| Active Idle | 0 | 0 | |
| Target Load | Actual Load | ssj_ops | |
|---|---|---|---|
| Target | Actual | ||
| Calibration 1 | 234,455 | ||
| Calibration 2 | 234,738 | ||
| Calibration 3 | 234,834 | ||
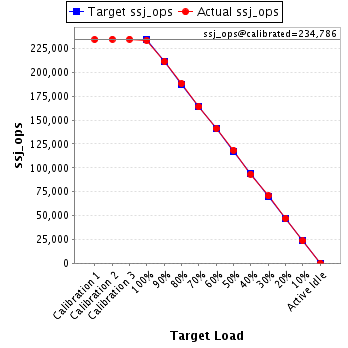
| ssj_ops@calibrated=234,786 | |||
| 100% | 99.4% | 234,786 | 233,427 |
| 90% | 90.1% | 211,307 | 211,450 |
| 80% | 80.2% | 187,829 | 188,347 |
| 70% | 69.8% | 164,350 | 163,952 |
| 60% | 60.2% | 140,871 | 141,267 |
| 50% | 50.4% | 117,393 | 118,364 |
| 40% | 39.8% | 93,914 | 93,407 |
| 30% | 30.0% | 70,436 | 70,500 |
| 20% | 20.1% | 46,957 | 47,085 |
| 10% | 10.0% | 23,479 | 23,506 |
| Active Idle | 0 | 0 | |
| Target Load | Actual Load | ssj_ops | |
|---|---|---|---|
| Target | Actual | ||
| Calibration 1 | 230,524 | ||
| Calibration 2 | 231,343 | ||
| Calibration 3 | 230,302 | ||
| ssj_ops@calibrated=230,823 | |||
| 100% | 99.4% | 230,823 | 229,537 |
| 90% | 89.7% | 207,740 | 207,041 |
| 80% | 79.4% | 184,658 | 183,332 |
| 70% | 70.4% | 161,576 | 162,417 |
| 60% | 60.2% | 138,494 | 138,891 |
| 50% | 50.0% | 115,411 | 115,406 |
| 40% | 39.8% | 92,329 | 91,970 |
| 30% | 30.3% | 69,247 | 69,874 |
| 20% | 20.2% | 46,165 | 46,719 |
| 10% | 10.1% | 23,082 | 23,369 |
| Active Idle | 0 | 0 | |

| Target Load | Actual Load | ssj_ops | |
|---|---|---|---|
| Target | Actual | ||
| Calibration 1 | 233,753 | ||
| Calibration 2 | 233,494 | ||
| Calibration 3 | 233,122 | ||
| ssj_ops@calibrated=233,308 | |||
| 100% | 99.8% | 233,308 | 232,915 |
| 90% | 89.6% | 209,977 | 209,087 |
| 80% | 80.5% | 186,646 | 187,774 |
| 70% | 70.1% | 163,316 | 163,651 |
| 60% | 60.8% | 139,985 | 141,768 |
| 50% | 50.2% | 116,654 | 117,038 |
| 40% | 40.0% | 93,323 | 93,392 |
| 30% | 30.1% | 69,992 | 70,267 |
| 20% | 19.6% | 46,662 | 45,741 |
| 10% | 9.8% | 23,331 | 22,952 |
| Active Idle | 0 | 0 | |

| Target Load | Actual Load | ssj_ops | |
|---|---|---|---|
| Target | Actual | ||
| Calibration 1 | 233,633 | ||
| Calibration 2 | 232,843 | ||
| Calibration 3 | 233,499 | ||
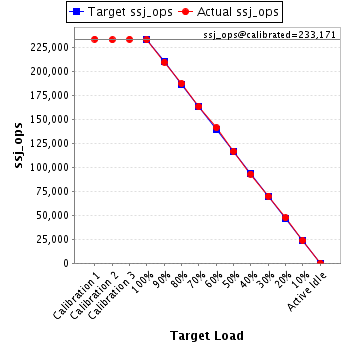
| ssj_ops@calibrated=233,171 | |||
| 100% | 99.9% | 233,171 | 232,913 |
| 90% | 89.9% | 209,854 | 209,647 |
| 80% | 80.4% | 186,537 | 187,463 |
| 70% | 70.1% | 163,220 | 163,433 |
| 60% | 60.6% | 139,902 | 141,371 |
| 50% | 50.1% | 116,585 | 116,737 |
| 40% | 39.9% | 93,268 | 93,031 |
| 30% | 30.0% | 69,951 | 69,955 |
| 20% | 20.3% | 46,634 | 47,377 |
| 10% | 10.2% | 23,317 | 23,685 |
| Active Idle | 0 | 0 | |
| Target Load | Actual Load | ssj_ops | |
|---|---|---|---|
| Target | Actual | ||
| Calibration 1 | 230,622 | ||
| Calibration 2 | 230,638 | ||
| Calibration 3 | 230,667 | ||
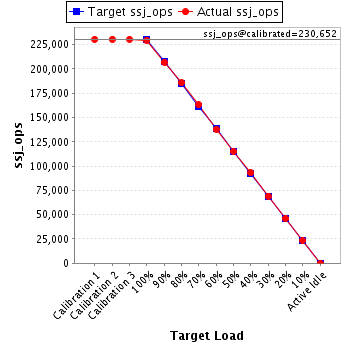
| ssj_ops@calibrated=230,652 | |||
| 100% | 99.6% | 230,652 | 229,738 |
| 90% | 89.7% | 207,587 | 206,850 |
| 80% | 80.5% | 184,522 | 185,621 |
| 70% | 70.8% | 161,457 | 163,223 |
| 60% | 59.9% | 138,391 | 138,068 |
| 50% | 50.0% | 115,326 | 115,241 |
| 40% | 40.3% | 92,261 | 93,057 |
| 30% | 30.0% | 69,196 | 69,224 |
| 20% | 20.0% | 46,130 | 46,069 |
| 10% | 10.2% | 23,065 | 23,551 |
| Active Idle | 0 | 0 | |
| Target Load | Actual Load | ssj_ops | |
|---|---|---|---|
| Target | Actual | ||
| Calibration 1 | 231,687 | ||
| Calibration 2 | 231,884 | ||
| Calibration 3 | 232,613 | ||
| ssj_ops@calibrated=232,248 | |||
| 100% | 99.6% | 232,248 | 231,309 |
| 90% | 89.9% | 209,024 | 208,856 |
| 80% | 80.0% | 185,799 | 185,776 |
| 70% | 69.7% | 162,574 | 161,902 |
| 60% | 60.4% | 139,349 | 140,375 |
| 50% | 49.9% | 116,124 | 115,961 |
| 40% | 40.0% | 92,899 | 92,909 |
| 30% | 30.1% | 69,675 | 69,961 |
| 20% | 20.0% | 46,450 | 46,534 |
| 10% | 10.1% | 23,225 | 23,562 |
| Active Idle | 0 | 0 | |

| Target Load | Actual Load | ssj_ops | |
|---|---|---|---|
| Target | Actual | ||
| Calibration 1 | 236,064 | ||
| Calibration 2 | 235,713 | ||
| Calibration 3 | 235,523 | ||
| ssj_ops@calibrated=235,618 | |||
| 100% | 99.8% | 235,618 | 235,190 |
| 90% | 90.4% | 212,056 | 212,954 |
| 80% | 79.8% | 188,494 | 187,982 |
| 70% | 70.0% | 164,932 | 164,923 |
| 60% | 60.5% | 141,371 | 142,654 |
| 50% | 49.8% | 117,809 | 117,222 |
| 40% | 39.4% | 94,247 | 92,912 |
| 30% | 30.2% | 70,685 | 71,262 |
| 20% | 20.0% | 47,124 | 47,166 |
| 10% | 10.0% | 23,562 | 23,491 |
| Active Idle | 0 | 0 | |
