
SPECpower_ssj2008
Host 'm915-8' Performance Report
Copyright © 2007-2011 Standard Performance Evaluation Corporation
| Dell Inc. PowerEdge M915 | ssj_ops@100% = 1,849,680 ssj_ops@100% per JVM = 231,210 |
||||
| Test Sponsor: | Dell Inc. | SPEC License #: | 55 | Test Method: | Multi Node |
| Tested By: | Dell Inc. | Test Location: | Round Rock, TX, USA | Test Date: | Jun 28, 2011 |
| Hardware Availability: | Jun-2011 | Software Availability: | Feb-2011 | Publication: | Aug 2, 2011 |
| System Source: | Single Supplier | System Designation: | Server | Power Provisioning: | Line-powered |
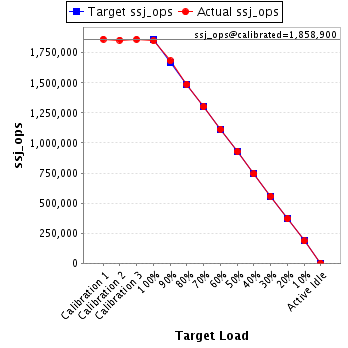
| Target Load | Actual Load | ssj_ops | |
|---|---|---|---|
| Target | Actual | ||
| Calibration 1 | 1,863,056 | ||
| Calibration 2 | 1,855,685 | ||
| Calibration 3 | 1,862,114 | ||
| ssj_ops@calibrated=1,858,900 | |||
| 100% | 99.5% | 1,858,900 | 1,849,680 |
| 90% | 90.5% | 1,673,010 | 1,682,514 |
| 80% | 80.0% | 1,487,120 | 1,487,373 |
| 70% | 70.0% | 1,301,230 | 1,301,293 |
| 60% | 59.9% | 1,115,340 | 1,113,835 |
| 50% | 50.0% | 929,450 | 928,815 |
| 40% | 39.9% | 743,560 | 742,567 |
| 30% | 30.0% | 557,670 | 558,540 |
| 20% | 19.9% | 371,780 | 370,574 |
| 10% | 10.0% | 185,890 | 185,100 |
| Active Idle | 0 | 0 | |
| Set Identifier: | sut |
| Set Description: | PowerEdge M915 |
| # of Identical Nodes: | 8 |
| Comment: | None |
| Hardware | |
|---|---|
| Hardware Vendor: | Dell Inc. |
| Model: | PowerEdge M915 |
| Form Factor: | Blade |
| CPU Name: | AMD Opteron 6176 (2.30 GHz) |
| CPU Characteristics: | 12 Core, 2.30 GHz, 12 MB L3 Cache |
| CPU Frequency (MHz): | 2300 |
| CPU(s) Enabled: | 48 cores, 4 chips, 12 cores/chip |
| Hardware Threads: | 48 (1 / core) |
| CPU(s) Orderable: | 2,4 chips |
| Primary Cache: | 64 KB I + 64 KB D on chip per core |
| Secondary Cache: | 512 KB I+D on chip per core |
| Tertiary Cache: | 12 MB I+D on chip per chip, 6MB shared / 6 cores |
| Other Cache: | None |
| Memory Amount (GB): | 32 |
| # and size of DIMM: | 16 x 2048 MB |
| Memory Details: | 2GB 1Rx8 PC3L-10600R ECC RDIMM, Slots A1-A4, B1-B4, C1-C4, D1-D4 populated |
| Power Supply Quantity and Rating (W): | None |
| Power Supply Details: | N/A |
| Disk Drive: | 1 x 50 GB 2.5" SSD P/N X2N7H |
| Disk Controller: | PERC H200 Modular |
| # and type of Network Interface Cards (NICs) Installed: | 2 x onboard dual-port 1 Gigabit Ethernet |
| NICs Enabled in Firmware / OS / Connected: | 2/2/1 |
| Network Speed (Mbit): | 1000 |
| Keyboard: | None |
| Mouse: | None |
| Monitor: | None |
| Optical Drives: | No |
| Other Hardware: | None |
| Software | |
|---|---|
| Power Management: | Balanced Mode in OS (See Notes) |
| Operating System (OS): | Windows 2008 Server Enterprise x64 Edition |
| OS Version: | R2 SP1 |
| Filesystem: | NTFS |
| JVM Vendor: | IBM Corporation |
| JVM Version: | IBM J9 VM (build 2.4, J2RE 1.6.0 IBM J9 2.4 Windows Server 2008 amd64-64 jvmwa64 60sr5-20090519_35743 (JIT enabled, AOT enabled) |
| JVM Command-line Options: | -Xaggressive -Xcompressedrefs -Xgcpolicy:gencon -Xmn1400m -Xms1875m -Xmx1875m -XlockReservation -Xnoloa -XtlhPrefetch -Xlp |
| JVM Affinity: | start /affinity [3F, FC0, 3F000, FC0000, 3F000000, FC0000000, 3F000000000, FC0000000000] |
| JVM Instances: | 8 |
| JVM Initial Heap (MB): | 1875 |
| JVM Maximum Heap (MB): | 1875 |
| JVM Address Bits: | 64 |
| Boot Firmware Version: | 1.0.3 |
| Management Firmware Version: | iDRAC 3.21 build 48 |
| Workload Version: | SSJ 1.2.6 |
| Director Location: | Controller |
| Other Software: | IBM WebSphere Application Server |
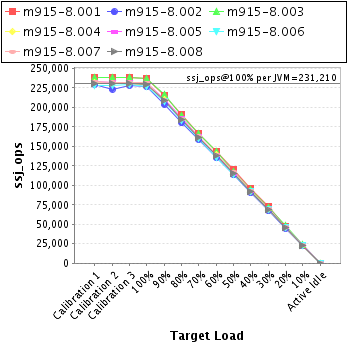
| JVM Instance | ssj_ops@100% |
|---|---|
| m915-8.001 | 237,128 |
| m915-8.002 | 226,430 |
| m915-8.003 | 236,610 |
| m915-8.004 | 229,228 |
| m915-8.005 | 231,763 |
| m915-8.006 | 227,496 |
| m915-8.007 | 231,742 |
| m915-8.008 | 229,282 |
| ssj_ops@100% | 1,849,680 |
| ssj_ops@100% per JVM | 231,210 |
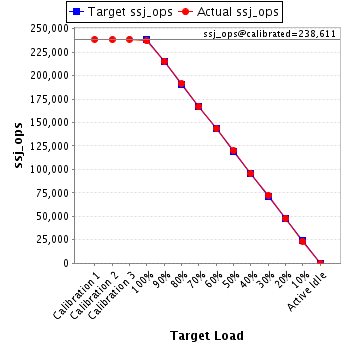
| Target Load | Actual Load | ssj_ops | |
|---|---|---|---|
| Target | Actual | ||
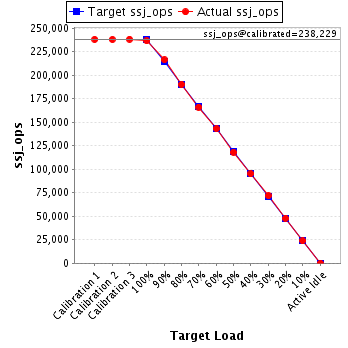
| Calibration 1 | 238,643 | ||
| Calibration 2 | 238,365 | ||
| Calibration 3 | 238,857 | ||
| ssj_ops@calibrated=238,611 | |||
| 100% | 99.4% | 238,611 | 237,128 |
| 90% | 90.2% | 214,750 | 215,273 |
| 80% | 80.2% | 190,889 | 191,404 |
| 70% | 69.9% | 167,028 | 166,780 |
| 60% | 60.1% | 143,167 | 143,502 |
| 50% | 50.3% | 119,306 | 119,955 |
| 40% | 40.1% | 95,444 | 95,781 |
| 30% | 30.3% | 71,583 | 72,341 |
| 20% | 20.0% | 47,722 | 47,725 |
| 10% | 9.8% | 23,861 | 23,424 |
| Active Idle | 0 | 0 | |
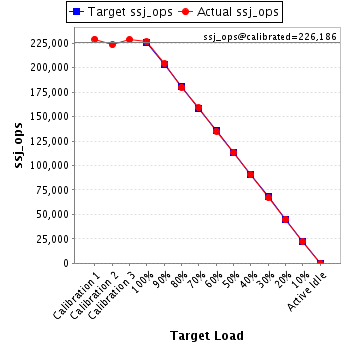
| Target Load | Actual Load | ssj_ops | |
|---|---|---|---|
| Target | Actual | ||
| Calibration 1 | 229,231 | ||
| Calibration 2 | 223,636 | ||
| Calibration 3 | 228,736 | ||
| ssj_ops@calibrated=226,186 | |||
| 100% | 100.1% | 226,186 | 226,430 |
| 90% | 90.2% | 203,568 | 204,116 |
| 80% | 79.6% | 180,949 | 180,115 |
| 70% | 70.2% | 158,330 | 158,870 |
| 60% | 59.8% | 135,712 | 135,251 |
| 50% | 50.1% | 113,093 | 113,367 |
| 40% | 40.0% | 90,474 | 90,424 |
| 30% | 29.7% | 67,856 | 67,224 |
| 20% | 19.8% | 45,237 | 44,831 |
| 10% | 9.8% | 22,619 | 22,236 |
| Active Idle | 0 | 0 | |
| Target Load | Actual Load | ssj_ops | |
|---|---|---|---|
| Target | Actual | ||
| Calibration 1 | 238,165 | ||
| Calibration 2 | 238,068 | ||
| Calibration 3 | 238,390 | ||
| ssj_ops@calibrated=238,229 | |||
| 100% | 99.3% | 238,229 | 236,610 |
| 90% | 90.9% | 214,406 | 216,466 |
| 80% | 79.9% | 190,583 | 190,257 |
| 70% | 69.8% | 166,760 | 166,172 |
| 60% | 60.1% | 142,937 | 143,257 |
| 50% | 49.6% | 119,114 | 118,252 |
| 40% | 39.9% | 95,292 | 95,039 |
| 30% | 30.1% | 71,469 | 71,814 |
| 20% | 20.2% | 47,646 | 48,017 |
| 10% | 10.0% | 23,823 | 23,789 |
| Active Idle | 0 | 0 | |
| Target Load | Actual Load | ssj_ops | |
|---|---|---|---|
| Target | Actual | ||
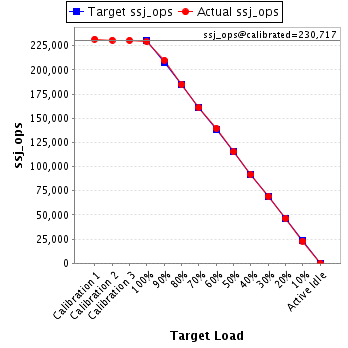
| Calibration 1 | 231,829 | ||
| Calibration 2 | 230,781 | ||
| Calibration 3 | 230,654 | ||
| ssj_ops@calibrated=230,717 | |||
| 100% | 99.4% | 230,717 | 229,228 |
| 90% | 91.1% | 207,645 | 210,087 |
| 80% | 80.2% | 184,574 | 185,036 |
| 70% | 69.8% | 161,502 | 161,083 |
| 60% | 60.5% | 138,430 | 139,613 |
| 50% | 49.9% | 115,359 | 115,222 |
| 40% | 39.8% | 92,287 | 91,817 |
| 30% | 30.0% | 69,215 | 69,134 |
| 20% | 20.1% | 46,143 | 46,471 |
| 10% | 10.0% | 23,072 | 22,981 |
| Active Idle | 0 | 0 | |
| Target Load | Actual Load | ssj_ops | |
|---|---|---|---|
| Target | Actual | ||
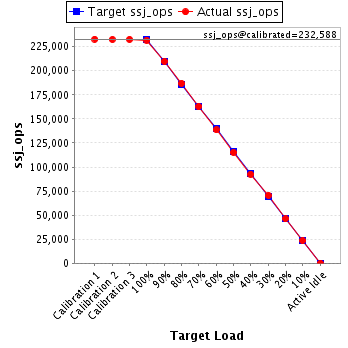
| Calibration 1 | 232,857 | ||
| Calibration 2 | 232,515 | ||
| Calibration 3 | 232,661 | ||
| ssj_ops@calibrated=232,588 | |||
| 100% | 99.6% | 232,588 | 231,763 |
| 90% | 90.2% | 209,329 | 209,828 |
| 80% | 80.4% | 186,070 | 186,997 |
| 70% | 70.0% | 162,812 | 162,887 |
| 60% | 59.6% | 139,553 | 138,621 |
| 50% | 49.5% | 116,294 | 115,196 |
| 40% | 39.8% | 93,035 | 92,465 |
| 30% | 30.3% | 69,776 | 70,581 |
| 20% | 19.8% | 46,518 | 46,139 |
| 10% | 10.1% | 23,259 | 23,606 |
| Active Idle | 0 | 0 | |
| Target Load | Actual Load | ssj_ops | |
|---|---|---|---|
| Target | Actual | ||
| Calibration 1 | 228,463 | ||
| Calibration 2 | 228,794 | ||
| Calibration 3 | 229,398 | ||
| ssj_ops@calibrated=229,096 | |||
| 100% | 99.3% | 229,096 | 227,496 |
| 90% | 90.7% | 206,186 | 207,737 |
| 80% | 80.0% | 183,277 | 183,207 |
| 70% | 70.2% | 160,367 | 160,757 |
| 60% | 59.4% | 137,458 | 136,060 |
| 50% | 49.7% | 114,548 | 113,777 |
| 40% | 40.1% | 91,638 | 91,841 |
| 30% | 29.9% | 68,729 | 68,607 |
| 20% | 19.8% | 45,819 | 45,362 |
| 10% | 9.9% | 22,910 | 22,619 |
| Active Idle | 0 | 0 | |

| Target Load | Actual Load | ssj_ops | |
|---|---|---|---|
| Target | Actual | ||
| Calibration 1 | 233,309 | ||
| Calibration 2 | 232,527 | ||
| Calibration 3 | 232,432 | ||
| ssj_ops@calibrated=232,479 | |||
| 100% | 99.7% | 232,479 | 231,742 |
| 90% | 90.1% | 209,231 | 209,517 |
| 80% | 79.9% | 185,983 | 185,770 |
| 70% | 70.0% | 162,736 | 162,755 |
| 60% | 60.0% | 139,488 | 139,602 |
| 50% | 50.4% | 116,240 | 117,236 |
| 40% | 40.0% | 92,992 | 93,070 |
| 30% | 30.2% | 69,744 | 70,271 |
| 20% | 20.0% | 46,496 | 46,401 |
| 10% | 10.0% | 23,248 | 23,134 |
| Active Idle | 0 | 0 | |

| Target Load | Actual Load | ssj_ops | |
|---|---|---|---|
| Target | Actual | ||
| Calibration 1 | 230,559 | ||
| Calibration 2 | 231,000 | ||
| Calibration 3 | 230,986 | ||
| ssj_ops@calibrated=230,993 | |||
| 100% | 99.3% | 230,993 | 229,282 |
| 90% | 90.7% | 207,894 | 209,492 |
| 80% | 79.9% | 184,795 | 184,588 |
| 70% | 70.1% | 161,695 | 161,989 |
| 60% | 59.7% | 138,596 | 137,930 |
| 50% | 50.1% | 115,497 | 115,810 |
| 40% | 39.9% | 92,397 | 92,131 |
| 30% | 29.7% | 69,298 | 68,569 |
| 20% | 19.8% | 46,199 | 45,628 |
| 10% | 10.1% | 23,099 | 23,309 |
| Active Idle | 0 | 0 | |
