
SPECpower_ssj2008
Host 'WIN-V98PA5GCDMH' Performance Report
Copyright © 2007-2011 Standard Performance Evaluation Corporation
| Dell Inc. PowerEdge C6100 (Intel Xeon X5675, 3.06 GHz) | ssj_ops@100% = 906,807 ssj_ops@100% per JVM = 453,404 |
||||
| Test Sponsor: | Dell Inc. | SPEC License #: | 55 | Test Method: | Multi Node |
| Tested By: | Dell Inc. | Test Location: | Round Rock, TX, USA | Test Date: | Oct 7, 2011 |
| Hardware Availability: | Sep-2011 | Software Availability: | Apr-2011 | Publication: | Nov 2, 2011 |
| System Source: | Single Supplier | System Designation: | Server | Power Provisioning: | Line-powered |
| Target Load | Actual Load | ssj_ops | |
|---|---|---|---|
| Target | Actual | ||
| Calibration 1 | 912,887 | ||
| Calibration 2 | 912,457 | ||
| Calibration 3 | 912,921 | ||
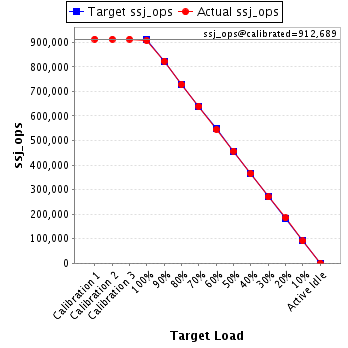
| ssj_ops@calibrated=912,689 | |||
| 100% | 99.4% | 912,689 | 906,807 |
| 90% | 90.2% | 821,420 | 823,494 |
| 80% | 79.8% | 730,151 | 728,043 |
| 70% | 70.0% | 638,883 | 639,210 |
| 60% | 59.7% | 547,614 | 544,875 |
| 50% | 50.1% | 456,345 | 457,153 |
| 40% | 39.9% | 365,076 | 364,428 |
| 30% | 29.6% | 273,807 | 269,999 |
| 20% | 20.2% | 182,538 | 184,478 |
| 10% | 9.9% | 91,269 | 90,805 |
| Active Idle | 0 | 0 | |
| Set Identifier: | sut |
| Set Description: | System Under Test |
| # of Identical Nodes: | 4 |
| Comment: | None |
| Hardware | |
|---|---|
| Hardware Vendor: | Dell Inc. |
| Model: | PowerEdge C6100 (Intel Xeon X5675, 3.06 GHz) |
| Form Factor: | 2U |
| CPU Name: | Intel Xeon 5675 |
| CPU Characteristics: | 6-Core, 3.06GHz, 12MB L3 Cache |
| CPU Frequency (MHz): | 3067 |
| CPU(s) Enabled: | 12 cores, 2 chips, 6 cores/chip |
| Hardware Threads: | 24 (2 / core) |
| CPU(s) Orderable: | 1,2 chips |
| Primary Cache: | 32 KB I + 32 KB D on chip per core |
| Secondary Cache: | 256 KB I+D on chip per core |
| Tertiary Cache: | 12 MB I+D on chip per chip |
| Other Cache: | None |
| Memory Amount (GB): | 16 |
| # and size of DIMM: | 4 x 4096 MB |
| Memory Details: | 4GB 2Rx8 PC3L-10600R ECC ; slots A0,A1,B0,B1 populated |
| Power Supply Quantity and Rating (W): | None |
| Power Supply Details: | N/A |
| Disk Drive: | 1 x 50GB SSD 2.5" SATA (Dell PN Y949P) |
| Disk Controller: | On Board SATA |
| # and type of Network Interface Cards (NICs) Installed: | 1 x Intel(R) 82576 Gigabit Dual Port Network Connection |
| NICs Enabled in Firmware / OS / Connected: | 2/2/1 |
| Network Speed (Mbit): | 1000 |
| Keyboard: | None |
| Mouse: | None |
| Monitor: | None |
| Optical Drives: | No |
| Other Hardware: | None |
| Software | |
|---|---|
| Power Management: | Enabled (See SUT Notes) |
| Operating System (OS): | Microsoft Windows 2008 Enterprise x64 Edition |
| OS Version: | R2 SP1 (64-bit) |
| Filesystem: | NTFS |
| JVM Vendor: | Oracle Corporation |
| JVM Version: | Oracle Java HotSpot(TM) 64-Bit Server VM on Windows, version 1.6.0_27 |
| JVM Command-line Options: | -server -Xmx6g -Xms6g -Xmn5g -XX:SurvivorRatio=55 -XX:TargetSurvivorRatio=90 -XX:ParallelGCThreads=12 -XX:AllocatePrefetchDistance=256 -XX:AllocatePrefetchLines=4 -XX:LoopUnrollLimit=45 -XX:InitialTenuringThreshold=12 -XX:MaxTenuringThreshold=15 -XX:InlineSmallCode=3900 -XX:MaxInlineSize=270 -XX:FreqInlineSize=2500 -XX:+UseLargePages -XX:+UseParallelOldGC -XX:+UseCompressedStrings -XX:+AggressiveOpts |
| JVM Affinity: | start /affinity [000FFF,FFF000] |
| JVM Instances: | 2 |
| JVM Initial Heap (MB): | 6144 |
| JVM Maximum Heap (MB): | 6144 |
| JVM Address Bits: | 64 |
| Boot Firmware Version: | 1.64 |
| Management Firmware Version: | 1.24 |
| Workload Version: | SSJ 1.2.6 |
| Director Location: | Controller |
| Other Software: | None |
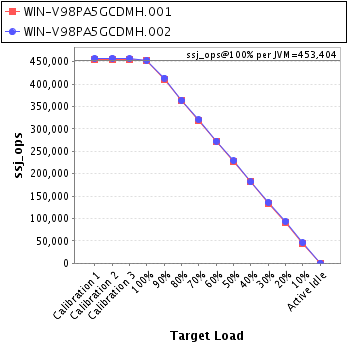
| JVM Instance | ssj_ops@100% |
|---|---|
| WIN-V98PA5GCDMH.001 | 453,650 |
| WIN-V98PA5GCDMH.002 | 453,157 |
| ssj_ops@100% | 906,807 |
| ssj_ops@100% per JVM | 453,404 |
| Target Load | Actual Load | ssj_ops | |
|---|---|---|---|
| Target | Actual | ||
| Calibration 1 | 455,261 | ||
| Calibration 2 | 454,466 | ||
| Calibration 3 | 455,892 | ||
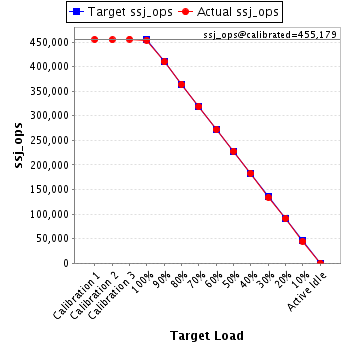
| ssj_ops@calibrated=455,179 | |||
| 100% | 99.7% | 455,179 | 453,650 |
| 90% | 90.0% | 409,661 | 409,779 |
| 80% | 80.0% | 364,143 | 363,933 |
| 70% | 70.0% | 318,625 | 318,661 |
| 60% | 59.8% | 273,107 | 272,243 |
| 50% | 50.1% | 227,590 | 228,180 |
| 40% | 40.2% | 182,072 | 182,864 |
| 30% | 29.5% | 136,554 | 134,061 |
| 20% | 20.0% | 91,036 | 91,051 |
| 10% | 9.8% | 45,518 | 44,610 |
| Active Idle | 0 | 0 | |
| Target Load | Actual Load | ssj_ops | |
|---|---|---|---|
| Target | Actual | ||
| Calibration 1 | 457,626 | ||
| Calibration 2 | 457,991 | ||
| Calibration 3 | 457,030 | ||
| ssj_ops@calibrated=457,510 | |||
| 100% | 99.0% | 457,510 | 453,157 |
| 90% | 90.4% | 411,759 | 413,715 |
| 80% | 79.6% | 366,008 | 364,110 |
| 70% | 70.1% | 320,257 | 320,549 |
| 60% | 59.6% | 274,506 | 272,632 |
| 50% | 50.0% | 228,755 | 228,973 |
| 40% | 39.7% | 183,004 | 181,564 |
| 30% | 29.7% | 137,253 | 135,938 |
| 20% | 20.4% | 91,502 | 93,427 |
| 10% | 10.1% | 45,751 | 46,194 |
| Active Idle | 0 | 0 | |
