SPECpower_ssj2008
Host 'SM-Power' Performance Report
Copyright © 2007-2011 Standard Performance Evaluation Corporation
| Supermicro Computer Inc. 1022G-NTF | ssj_ops@100% = 1,123,597 ssj_ops@100% per JVM = 140,450 |
||||
| Test Sponsor: | Advanced Micro Devices | SPEC License #: | 49 | Test Method: | Single Node |
| Tested By: | Advanced Micro Devices | Test Location: | Austin, TX, USA | Test Date: | Sep 13, 2011 |
| Hardware Availability: | Nov-2011 | Software Availability: | Mar-2011 | Publication: | Nov 16, 2011 |
| System Source: | Single Supplier | System Designation: | Server | Power Provisioning: | Line-powered |
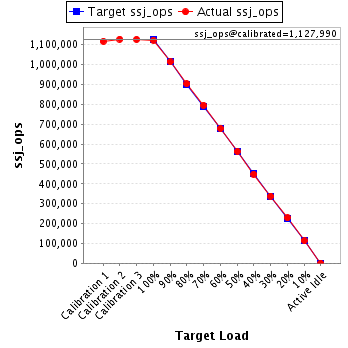
| Target Load | Actual Load | ssj_ops | |
|---|---|---|---|
| Target | Actual | ||
| Calibration 1 | 1,117,713 | ||
| Calibration 2 | 1,128,378 | ||
| Calibration 3 | 1,127,602 | ||
| ssj_ops@calibrated=1,127,990 | |||
| 100% | 99.6% | 1,127,990 | 1,123,597 |
| 90% | 89.9% | 1,015,191 | 1,013,844 |
| 80% | 80.1% | 902,392 | 903,747 |
| 70% | 70.5% | 789,593 | 795,600 |
| 60% | 60.2% | 676,794 | 678,792 |
| 50% | 49.9% | 563,995 | 563,198 |
| 40% | 39.8% | 451,196 | 448,983 |
| 30% | 30.0% | 338,397 | 338,544 |
| 20% | 20.2% | 225,598 | 228,297 |
| 10% | 10.1% | 112,799 | 113,656 |
| Active Idle | 0 | 0 | |
| Set Identifier: | sut |
| Set Description: | System Under Test |
| # of Identical Nodes: | 1 |
| Comment: | None |
| Hardware | |
|---|---|
| Hardware Vendor: | Supermicro Computer Inc. |
| Model: | 1022G-NTF |
| Form Factor: | 1U |
| CPU Name: | AMD Opteron 6276 |
| CPU Characteristics: | Sixteen-Core, 2.3GHz, 16MB L3 Cache |
| CPU Frequency (MHz): | 2300 |
| CPU(s) Enabled: | 32 cores, 2 chips, 16 cores/chip |
| Hardware Threads: | 32 (1 / core) |
| CPU(s) Orderable: | 1,2 chips |
| Primary Cache: | 512 KB I + 256 KB D on chip per chip |
| Secondary Cache: | 16 MB I+D on chip per chip, 2 MB shared / 2 cores |
| Tertiary Cache: | 16 MB I+D on chip per chip, 8 MB shared / 8 cores |
| Other Cache: | None |
| Memory Amount (GB): | 32 |
| # and size of DIMM: | 8 x 4096 MB |
| Memory Details: | 4GB 2Rx4 PC3L-10600R ECC CL9; slots 1A, 2A, 3A, 4A, populated for each socket |
| Power Supply Quantity and Rating (W): | 1 x 560 |
| Power Supply Details: | Supermicro Computer Inc. PWS-563-1H20 |
| Disk Drive: | 1 x 256GB Crucial C300 SATA SSD |
| Disk Controller: | Integrated AMD SP5100 SATA Controller |
| # and type of Network Interface Cards (NICs) Installed: | 2 x Intel 82576 Gigabit NIC |
| NICs Enabled in Firmware / OS / Connected: | 2/2/1 |
| Network Speed (Mbit): | 1000 |
| Keyboard: | None |
| Mouse: | None |
| Monitor: | Direct |
| Optical Drives: | Yes |
| Other Hardware: | None |
| Software | |
|---|---|
| Power Management: | Balanced Power Profile Enabled |
| Operating System (OS): | Microsoft Windows Server 2008 R2 Enterprise |
| OS Version: | SP1 (64-bit) |
| Filesystem: | NTFS |
| JVM Vendor: | IBM Corporation |
| JVM Version: | IBM J9 VM (build 2.4, JRE 1.6.0 IBM J9 2.4 Windows Server 2008 R2 amd64-64 jvmwa6460sr9-20101209_70480 (JIT enabled, AOT enabled) |
| JVM Command-line Options: | -Xms1875m -Xmn1400m -Xmx1875m -Xaggressive -Xcompressedrefs -Xnoloa -Xlp -XlockReservation -Xgcpolicy:gencon |
| JVM Affinity: | start /affinity [node 0/0F,F0|node 1/0F,F0|node 2/0F,F0|node 3/0F,F0] |
| JVM Instances: | 8 |
| JVM Initial Heap (MB): | 1875 |
| JVM Maximum Heap (MB): | 1875 |
| JVM Address Bits: | 64 |
| Boot Firmware Version: | H8DGU1.908 |
| Management Firmware Version: | 2.23 |
| Workload Version: | SSJ 1.2.6 |
| Director Location: | Controller |
| Other Software: | IBM Websphere Application Server V7.0 for Windows on x86-64 |
| JVM Instance | ssj_ops@100% |
|---|---|
| SM-Power.001 | 142,375 |
| SM-Power.002 | 139,999 |
| SM-Power.003 | 140,587 |
| SM-Power.004 | 139,778 |
| SM-Power.005 | 140,167 |
| SM-Power.006 | 140,619 |
| SM-Power.007 | 139,376 |
| SM-Power.008 | 140,697 |
| ssj_ops@100% | 1,123,597 |
| ssj_ops@100% per JVM | 140,450 |

| Target Load | Actual Load | ssj_ops | |
|---|---|---|---|
| Target | Actual | ||
| Calibration 1 | 143,136 | ||
| Calibration 2 | 142,257 | ||
| Calibration 3 | 142,369 | ||
| ssj_ops@calibrated=142,313 | |||
| 100% | 100.0% | 142,313 | 142,375 |
| 90% | 90.0% | 128,082 | 128,102 |
| 80% | 80.2% | 113,850 | 114,163 |
| 70% | 70.7% | 99,619 | 100,589 |
| 60% | 60.1% | 85,388 | 85,576 |
| 50% | 49.5% | 71,156 | 70,471 |
| 40% | 40.2% | 56,925 | 57,265 |
| 30% | 30.4% | 42,694 | 43,247 |
| 20% | 19.7% | 28,463 | 28,031 |
| 10% | 10.2% | 14,231 | 14,549 |
| Active Idle | 0 | 0 | |

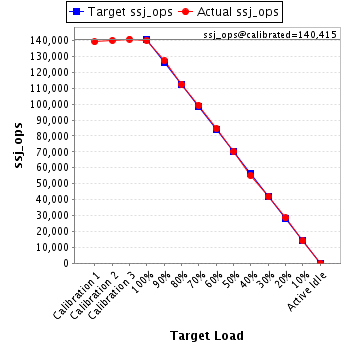
| Target Load | Actual Load | ssj_ops | |
|---|---|---|---|
| Target | Actual | ||
| Calibration 1 | 139,155 | ||
| Calibration 2 | 139,990 | ||
| Calibration 3 | 140,841 | ||
| ssj_ops@calibrated=140,415 | |||
| 100% | 99.7% | 140,415 | 139,999 |
| 90% | 90.6% | 126,374 | 127,217 |
| 80% | 80.1% | 112,332 | 112,441 |
| 70% | 70.6% | 98,291 | 99,129 |
| 60% | 60.2% | 84,249 | 84,501 |
| 50% | 50.0% | 70,208 | 70,221 |
| 40% | 39.3% | 56,166 | 55,184 |
| 30% | 29.8% | 42,125 | 41,864 |
| 20% | 20.3% | 28,083 | 28,557 |
| 10% | 10.0% | 14,042 | 14,000 |
| Active Idle | 0 | 0 | |
| Target Load | Actual Load | ssj_ops | |
|---|---|---|---|
| Target | Actual | ||
| Calibration 1 | 140,247 | ||
| Calibration 2 | 140,134 | ||
| Calibration 3 | 140,617 | ||
| ssj_ops@calibrated=140,375 | |||
| 100% | 100.2% | 140,375 | 140,587 |
| 90% | 89.8% | 126,338 | 126,117 |
| 80% | 79.4% | 112,300 | 111,481 |
| 70% | 70.6% | 98,263 | 99,171 |
| 60% | 60.2% | 84,225 | 84,532 |
| 50% | 49.7% | 70,188 | 69,757 |
| 40% | 39.9% | 56,150 | 56,014 |
| 30% | 30.3% | 42,113 | 42,543 |
| 20% | 20.4% | 28,075 | 28,675 |
| 10% | 10.4% | 14,038 | 14,575 |
| Active Idle | 0 | 0 | |

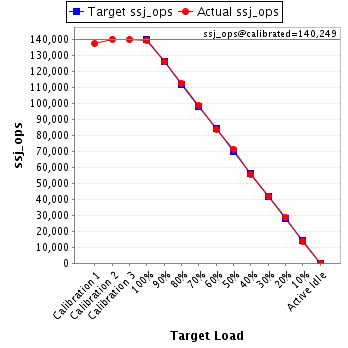
| Target Load | Actual Load | ssj_ops | |
|---|---|---|---|
| Target | Actual | ||
| Calibration 1 | 137,629 | ||
| Calibration 2 | 140,382 | ||
| Calibration 3 | 140,115 | ||
| ssj_ops@calibrated=140,249 | |||
| 100% | 99.7% | 140,249 | 139,778 |
| 90% | 90.0% | 126,224 | 126,172 |
| 80% | 80.2% | 112,199 | 112,484 |
| 70% | 70.4% | 98,174 | 98,709 |
| 60% | 59.8% | 84,149 | 83,852 |
| 50% | 50.9% | 70,124 | 71,342 |
| 40% | 39.8% | 56,099 | 55,877 |
| 30% | 29.9% | 42,075 | 41,958 |
| 20% | 20.2% | 28,050 | 28,378 |
| 10% | 9.9% | 14,025 | 13,907 |
| Active Idle | 0 | 0 | |
| Target Load | Actual Load | ssj_ops | |
|---|---|---|---|
| Target | Actual | ||
| Calibration 1 | 139,414 | ||
| Calibration 2 | 141,568 | ||
| Calibration 3 | 140,578 | ||
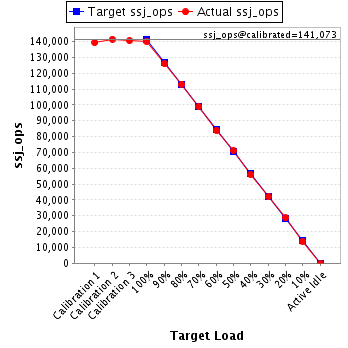
| ssj_ops@calibrated=141,073 | |||
| 100% | 99.4% | 141,073 | 140,167 |
| 90% | 89.4% | 126,966 | 126,083 |
| 80% | 80.2% | 112,859 | 113,135 |
| 70% | 70.1% | 98,751 | 98,850 |
| 60% | 59.6% | 84,644 | 84,109 |
| 50% | 50.4% | 70,537 | 71,168 |
| 40% | 39.7% | 56,429 | 55,969 |
| 30% | 29.8% | 42,322 | 42,049 |
| 20% | 20.3% | 28,215 | 28,638 |
| 10% | 9.9% | 14,107 | 13,899 |
| Active Idle | 0 | 0 | |
| Target Load | Actual Load | ssj_ops | |
|---|---|---|---|
| Target | Actual | ||
| Calibration 1 | 139,215 | ||
| Calibration 2 | 141,752 | ||
| Calibration 3 | 141,467 | ||
| ssj_ops@calibrated=141,609 | |||
| 100% | 99.3% | 141,609 | 140,619 |
| 90% | 89.7% | 127,449 | 127,085 |
| 80% | 80.6% | 113,288 | 114,162 |
| 70% | 71.0% | 99,127 | 100,528 |
| 60% | 60.4% | 84,966 | 85,517 |
| 50% | 49.4% | 70,805 | 69,955 |
| 40% | 39.6% | 56,644 | 56,085 |
| 30% | 30.1% | 42,483 | 42,554 |
| 20% | 20.7% | 28,322 | 29,265 |
| 10% | 10.1% | 14,161 | 14,246 |
| Active Idle | 0 | 0 | |

| Target Load | Actual Load | ssj_ops | |
|---|---|---|---|
| Target | Actual | ||
| Calibration 1 | 139,192 | ||
| Calibration 2 | 140,485 | ||
| Calibration 3 | 139,937 | ||
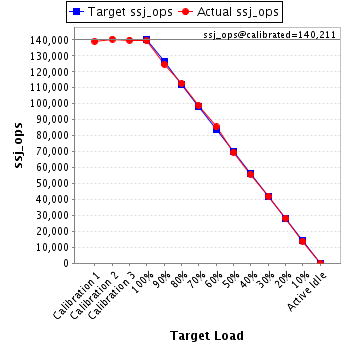
| ssj_ops@calibrated=140,211 | |||
| 100% | 99.4% | 140,211 | 139,376 |
| 90% | 89.0% | 126,190 | 124,775 |
| 80% | 80.4% | 112,169 | 112,740 |
| 70% | 70.5% | 98,148 | 98,841 |
| 60% | 61.0% | 84,127 | 85,465 |
| 50% | 49.6% | 70,106 | 69,571 |
| 40% | 39.8% | 56,084 | 55,772 |
| 30% | 30.0% | 42,063 | 42,065 |
| 20% | 20.2% | 28,042 | 28,349 |
| 10% | 9.9% | 14,021 | 13,843 |
| Active Idle | 0 | 0 | |
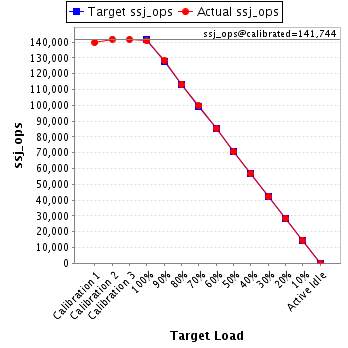
| Target Load | Actual Load | ssj_ops | |
|---|---|---|---|
| Target | Actual | ||
| Calibration 1 | 139,725 | ||
| Calibration 2 | 141,809 | ||
| Calibration 3 | 141,678 | ||
| ssj_ops@calibrated=141,744 | |||
| 100% | 99.3% | 141,744 | 140,697 |
| 90% | 90.5% | 127,569 | 128,294 |
| 80% | 79.8% | 113,395 | 113,141 |
| 70% | 70.4% | 99,221 | 99,782 |
| 60% | 60.1% | 85,046 | 85,240 |
| 50% | 49.9% | 70,872 | 70,713 |
| 40% | 40.1% | 56,697 | 56,817 |
| 30% | 29.8% | 42,523 | 42,263 |
| 20% | 20.0% | 28,349 | 28,404 |
| 10% | 10.3% | 14,174 | 14,637 |
| Active Idle | 0 | 0 | |