SPECpower_ssj2008
Host 'M915-02' Performance Report
Copyright © 2007-2011 Standard Performance Evaluation Corporation
| Dell Inc. PowerEdge M915 | ssj_ops@100% = 2,233,602 ssj_ops@100% per JVM = 139,600 |
||||
| Test Sponsor: | Dell Inc. | SPEC License #: | 55 | Test Method: | Multi Node |
| Tested By: | Dell Inc. | Test Location: | Round Rock, TX, USA | Test Date: | Oct 29, 2011 |
| Hardware Availability: | Nov-2011 | Software Availability: | Feb-2011 | Publication: | Nov 16, 2011 |
| System Source: | Single Supplier | System Designation: | Server | Power Provisioning: | Line-powered |
| Target Load | Actual Load | ssj_ops | |
|---|---|---|---|
| Target | Actual | ||
| Calibration 1 | 2,215,809 | ||
| Calibration 2 | 2,239,432 | ||
| Calibration 3 | 2,237,068 | ||
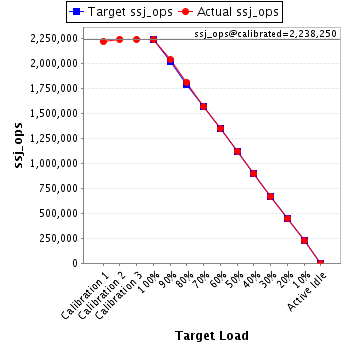
| ssj_ops@calibrated=2,238,250 | |||
| 100% | 99.8% | 2,238,250 | 2,233,602 |
| 90% | 90.9% | 2,014,425 | 2,035,537 |
| 80% | 80.8% | 1,790,600 | 1,808,170 |
| 70% | 70.0% | 1,566,775 | 1,566,856 |
| 60% | 60.1% | 1,342,950 | 1,345,003 |
| 50% | 50.0% | 1,119,125 | 1,119,682 |
| 40% | 39.9% | 895,300 | 892,964 |
| 30% | 29.9% | 671,475 | 668,736 |
| 20% | 19.9% | 447,650 | 446,074 |
| 10% | 10.1% | 223,825 | 225,764 |
| Active Idle | 0 | 0 | |
| Set Identifier: | sut |
| Set Description: | M915 |
| # of Identical Nodes: | 8 |
| Comment: | None |
| Hardware | |
|---|---|
| Hardware Vendor: | Dell Inc. |
| Model: | PowerEdge M915 |
| Form Factor: | Blade |
| CPU Name: | AMD Opteron 6276 (2.30 GHz) |
| CPU Characteristics: | 16 Core, 2.30 GHz, 16 MB L3 Cache |
| CPU Frequency (MHz): | 2300 |
| CPU(s) Enabled: | 64 cores, 4 chips, 16 cores/chip |
| Hardware Threads: | 64 (1 / core) |
| CPU(s) Orderable: | 2,4 chips |
| Primary Cache: | 512 KB I + 256 KB D on chip per chip |
| Secondary Cache: | 16 MB I+D on chip per chip, 2 MB shared / 2 cores |
| Tertiary Cache: | 16 MB I+D on chip per chip, 8MB shared / 8 cores |
| Other Cache: | None |
| Memory Amount (GB): | 64 |
| # and size of DIMM: | 16 x 4096 MB |
| Memory Details: | 4GB 2Rx8 PC3L-10600R ECC RDIMM, Slots A1-A4, B1-B4, C1-C4, D1-D4 populated |
| Power Supply Quantity and Rating (W): | None |
| Power Supply Details: | Shared |
| Disk Drive: | 1 x 50 GB 2.5" SSD SATA (Dell PN X2N7H) |
| Disk Controller: | PERC H200 Modular |
| # and type of Network Interface Cards (NICs) Installed: | 2 x onboard dual-port 1 Gigabit Ethernet |
| NICs Enabled in Firmware / OS / Connected: | 2/2/1 |
| Network Speed (Mbit): | 1000 |
| Keyboard: | None |
| Mouse: | None |
| Monitor: | None |
| Optical Drives: | No |
| Other Hardware: | None |
| Software | |
|---|---|
| Power Management: | Balanced Mode in OS (See Notes) |
| Operating System (OS): | Windows 2008 Server Enterprise x64 Edition |
| OS Version: | R2 SP1 |
| Filesystem: | NTFS |
| JVM Vendor: | IBM Corporation |
| JVM Version: | IBM J9 VM (build 2.4, J2RE 1.6.0 IBM J9 2.4 Windows Server 2008 amd64-64 jvmwa64 60sr5-20090519_35743 (JIT enabled, AOT enabled) |
| JVM Command-line Options: | -Xaggressive -Xcompressedrefs -Xgcpolicy:gencon -Xmn1400m -Xms1875m -Xmx1875m -XlockReservation -Xnoloa -Xlp |
| JVM Affinity: | start /affinity [F, F0, F00, F000, F0000, F00000, F000000, F0000000, F00000000, F000000000, F0000000000, F00000000000, F000000000000, F0000000000000, F00000000000000, F000000000000000] |
| JVM Instances: | 16 |
| JVM Initial Heap (MB): | 1875 |
| JVM Maximum Heap (MB): | 1875 |
| JVM Address Bits: | 64 |
| Boot Firmware Version: | 2.3.0 |
| Management Firmware Version: | iDRAC 3.30 build 17 |
| Workload Version: | SSJ 1.2.9 |
| Director Location: | Controller |
| Other Software: | IBM WebSphere Application Server V7.0 for Windows on x86-64bit |
| JVM Instance | ssj_ops@100% |
|---|---|
| M915-02.001 | 140,675 |
| M915-02.002 | 140,930 |
| M915-02.003 | 138,192 |
| M915-02.004 | 138,432 |
| M915-02.005 | 141,218 |
| M915-02.006 | 139,773 |
| M915-02.007 | 140,098 |
| M915-02.008 | 138,976 |
| M915-02.009 | 139,476 |
| M915-02.010 | 140,342 |
| M915-02.011 | 138,972 |
| M915-02.012 | 141,109 |
| M915-02.013 | 139,416 |
| M915-02.014 | 139,473 |
| M915-02.015 | 138,203 |
| M915-02.016 | 138,318 |
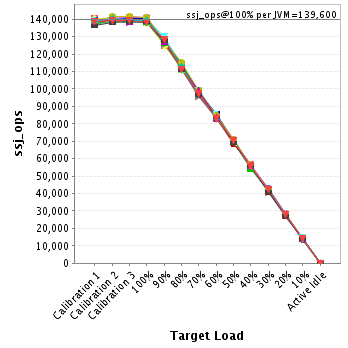
| ssj_ops@100% | 2,233,602 |
| ssj_ops@100% per JVM | 139,600 |
| Target Load | Actual Load | ssj_ops | |
|---|---|---|---|
| Target | Actual | ||
| Calibration 1 | 140,502 | ||
| Calibration 2 | 140,611 | ||
| Calibration 3 | 140,720 | ||
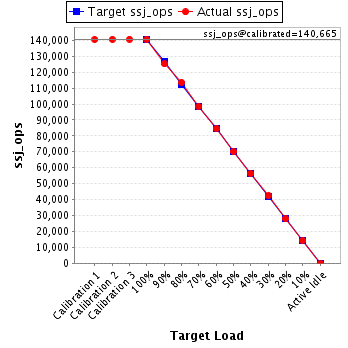
| ssj_ops@calibrated=140,665 | |||
| 100% | 100.0% | 140,665 | 140,675 |
| 90% | 89.0% | 126,599 | 125,169 |
| 80% | 80.7% | 112,532 | 113,520 |
| 70% | 70.1% | 98,466 | 98,555 |
| 60% | 60.1% | 84,399 | 84,487 |
| 50% | 49.9% | 70,333 | 70,194 |
| 40% | 40.1% | 56,266 | 56,427 |
| 30% | 30.0% | 42,200 | 42,252 |
| 20% | 19.8% | 28,133 | 27,894 |
| 10% | 10.1% | 14,067 | 14,155 |
| Active Idle | 0 | 0 | |
| Target Load | Actual Load | ssj_ops | |
|---|---|---|---|
| Target | Actual | ||
| Calibration 1 | 139,448 | ||
| Calibration 2 | 140,251 | ||
| Calibration 3 | 141,154 | ||
| ssj_ops@calibrated=140,703 | |||
| 100% | 100.2% | 140,703 | 140,930 |
| 90% | 90.9% | 126,632 | 127,963 |
| 80% | 81.3% | 112,562 | 114,342 |
| 70% | 70.1% | 98,492 | 98,594 |
| 60% | 60.1% | 84,422 | 84,513 |
| 50% | 50.5% | 70,351 | 71,101 |
| 40% | 39.9% | 56,281 | 56,161 |
| 30% | 30.4% | 42,211 | 42,805 |
| 20% | 20.3% | 28,141 | 28,586 |
| 10% | 10.2% | 14,070 | 14,335 |
| Active Idle | 0 | 0 | |

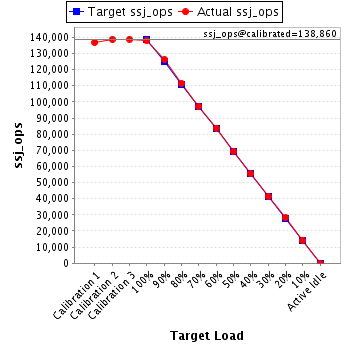
| Target Load | Actual Load | ssj_ops | |
|---|---|---|---|
| Target | Actual | ||
| Calibration 1 | 136,961 | ||
| Calibration 2 | 138,807 | ||
| Calibration 3 | 138,913 | ||
| ssj_ops@calibrated=138,860 | |||
| 100% | 99.5% | 138,860 | 138,192 |
| 90% | 90.9% | 124,974 | 126,279 |
| 80% | 80.2% | 111,088 | 111,411 |
| 70% | 70.1% | 97,202 | 97,360 |
| 60% | 60.4% | 83,316 | 83,823 |
| 50% | 50.0% | 69,430 | 69,487 |
| 40% | 40.0% | 55,544 | 55,571 |
| 30% | 29.9% | 41,658 | 41,578 |
| 20% | 20.3% | 27,772 | 28,150 |
| 10% | 10.3% | 13,886 | 14,239 |
| Active Idle | 0 | 0 | |
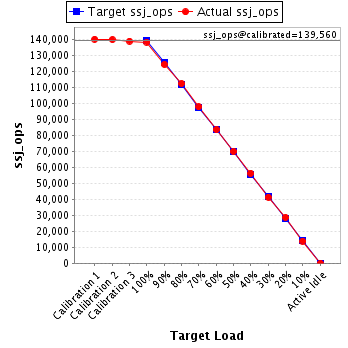
| Target Load | Actual Load | ssj_ops | |
|---|---|---|---|
| Target | Actual | ||
| Calibration 1 | 140,284 | ||
| Calibration 2 | 139,992 | ||
| Calibration 3 | 139,128 | ||
| ssj_ops@calibrated=139,560 | |||
| 100% | 99.2% | 139,560 | 138,432 |
| 90% | 89.2% | 125,604 | 124,508 |
| 80% | 80.6% | 111,648 | 112,530 |
| 70% | 70.1% | 97,692 | 97,860 |
| 60% | 60.0% | 83,736 | 83,758 |
| 50% | 50.2% | 69,780 | 70,095 |
| 40% | 40.4% | 55,824 | 56,422 |
| 30% | 29.6% | 41,868 | 41,375 |
| 20% | 20.6% | 27,912 | 28,709 |
| 10% | 10.0% | 13,956 | 13,901 |
| Active Idle | 0 | 0 | |
| Target Load | Actual Load | ssj_ops | |
|---|---|---|---|
| Target | Actual | ||
| Calibration 1 | 138,957 | ||
| Calibration 2 | 140,493 | ||
| Calibration 3 | 141,378 | ||
| ssj_ops@calibrated=140,936 | |||
| 100% | 100.2% | 140,936 | 141,218 |
| 90% | 90.8% | 126,842 | 128,035 |
| 80% | 80.7% | 112,748 | 113,707 |
| 70% | 69.5% | 98,655 | 97,960 |
| 60% | 60.2% | 84,561 | 84,859 |
| 50% | 49.9% | 70,468 | 70,282 |
| 40% | 40.0% | 56,374 | 56,397 |
| 30% | 29.9% | 42,281 | 42,116 |
| 20% | 19.4% | 28,187 | 27,377 |
| 10% | 10.3% | 14,094 | 14,462 |
| Active Idle | 0 | 0 | |

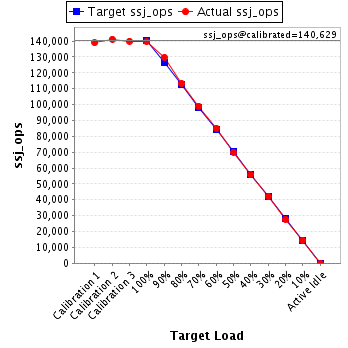
| Target Load | Actual Load | ssj_ops | |
|---|---|---|---|
| Target | Actual | ||
| Calibration 1 | 139,007 | ||
| Calibration 2 | 141,228 | ||
| Calibration 3 | 140,030 | ||
| ssj_ops@calibrated=140,629 | |||
| 100% | 99.4% | 140,629 | 139,773 |
| 90% | 92.3% | 126,566 | 129,828 |
| 80% | 80.7% | 112,503 | 113,451 |
| 70% | 70.4% | 98,440 | 99,048 |
| 60% | 60.5% | 84,377 | 85,093 |
| 50% | 49.8% | 70,314 | 70,016 |
| 40% | 39.6% | 56,252 | 55,711 |
| 30% | 30.1% | 42,189 | 42,305 |
| 20% | 19.7% | 28,126 | 27,752 |
| 10% | 10.4% | 14,063 | 14,600 |
| Active Idle | 0 | 0 | |
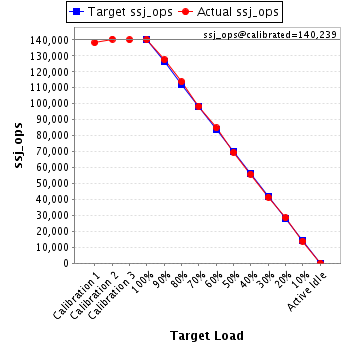
| Target Load | Actual Load | ssj_ops | |
|---|---|---|---|
| Target | Actual | ||
| Calibration 1 | 138,256 | ||
| Calibration 2 | 140,466 | ||
| Calibration 3 | 140,013 | ||
| ssj_ops@calibrated=140,239 | |||
| 100% | 99.9% | 140,239 | 140,098 |
| 90% | 91.0% | 126,216 | 127,593 |
| 80% | 81.1% | 112,192 | 113,693 |
| 70% | 70.2% | 98,168 | 98,410 |
| 60% | 60.5% | 84,144 | 84,865 |
| 50% | 49.6% | 70,120 | 69,536 |
| 40% | 39.8% | 56,096 | 55,813 |
| 30% | 29.6% | 42,072 | 41,479 |
| 20% | 20.3% | 28,048 | 28,473 |
| 10% | 9.9% | 14,024 | 13,904 |
| Active Idle | 0 | 0 | |
| Target Load | Actual Load | ssj_ops | |
|---|---|---|---|
| Target | Actual | ||
| Calibration 1 | 137,331 | ||
| Calibration 2 | 138,988 | ||
| Calibration 3 | 138,183 | ||
| ssj_ops@calibrated=138,585 | |||
| 100% | 100.3% | 138,585 | 138,976 |
| 90% | 90.6% | 124,727 | 125,592 |
| 80% | 80.6% | 110,868 | 111,686 |
| 70% | 69.1% | 97,010 | 95,772 |
| 60% | 59.9% | 83,151 | 83,008 |
| 50% | 50.5% | 69,293 | 70,021 |
| 40% | 40.2% | 55,434 | 55,674 |
| 30% | 29.2% | 41,576 | 40,434 |
| 20% | 19.8% | 27,717 | 27,463 |
| 10% | 10.1% | 13,859 | 13,944 |
| Active Idle | 0 | 0 | |

| Target Load | Actual Load | ssj_ops | |
|---|---|---|---|
| Target | Actual | ||
| Calibration 1 | 138,168 | ||
| Calibration 2 | 139,634 | ||
| Calibration 3 | 139,690 | ||
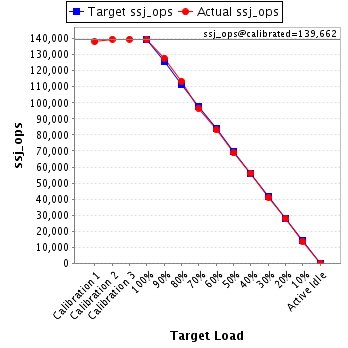
| ssj_ops@calibrated=139,662 | |||
| 100% | 99.9% | 139,662 | 139,476 |
| 90% | 91.5% | 125,696 | 127,841 |
| 80% | 81.2% | 111,730 | 113,437 |
| 70% | 69.3% | 97,763 | 96,744 |
| 60% | 59.5% | 83,797 | 83,134 |
| 50% | 49.3% | 69,831 | 68,843 |
| 40% | 40.2% | 55,865 | 56,149 |
| 30% | 29.4% | 41,899 | 41,042 |
| 20% | 19.8% | 27,932 | 27,664 |
| 10% | 9.9% | 13,966 | 13,784 |
| Active Idle | 0 | 0 | |
| Target Load | Actual Load | ssj_ops | |
|---|---|---|---|
| Target | Actual | ||
| Calibration 1 | 139,330 | ||
| Calibration 2 | 139,961 | ||
| Calibration 3 | 140,632 | ||
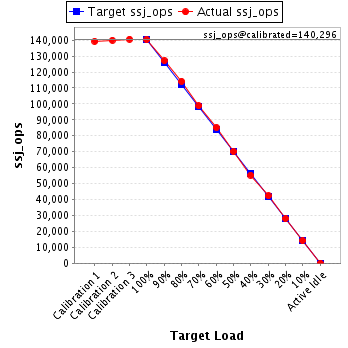
| ssj_ops@calibrated=140,296 | |||
| 100% | 100.0% | 140,296 | 140,342 |
| 90% | 90.6% | 126,267 | 127,089 |
| 80% | 81.4% | 112,237 | 114,231 |
| 70% | 70.4% | 98,207 | 98,756 |
| 60% | 60.7% | 84,178 | 85,183 |
| 50% | 50.1% | 70,148 | 70,250 |
| 40% | 39.4% | 56,119 | 55,303 |
| 30% | 30.1% | 42,089 | 42,257 |
| 20% | 20.0% | 28,059 | 28,019 |
| 10% | 10.1% | 14,030 | 14,222 |
| Active Idle | 0 | 0 | |
| Target Load | Actual Load | ssj_ops | |
|---|---|---|---|
| Target | Actual | ||
| Calibration 1 | 137,012 | ||
| Calibration 2 | 140,036 | ||
| Calibration 3 | 139,782 | ||
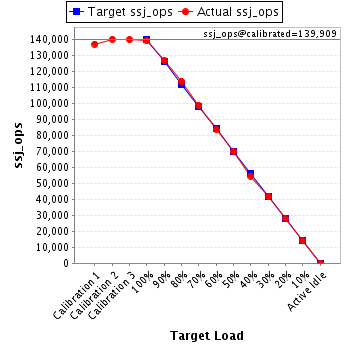
| ssj_ops@calibrated=139,909 | |||
| 100% | 99.3% | 139,909 | 138,972 |
| 90% | 90.5% | 125,918 | 126,588 |
| 80% | 81.2% | 111,927 | 113,646 |
| 70% | 70.5% | 97,936 | 98,705 |
| 60% | 59.8% | 83,945 | 83,685 |
| 50% | 50.0% | 69,955 | 69,932 |
| 40% | 39.0% | 55,964 | 54,502 |
| 30% | 30.0% | 41,973 | 41,909 |
| 20% | 19.8% | 27,982 | 27,690 |
| 10% | 10.0% | 13,991 | 13,980 |
| Active Idle | 0 | 0 | |
| Target Load | Actual Load | ssj_ops | |
|---|---|---|---|
| Target | Actual | ||
| Calibration 1 | 138,913 | ||
| Calibration 2 | 141,659 | ||
| Calibration 3 | 141,509 | ||
| ssj_ops@calibrated=141,584 | |||
| 100% | 99.7% | 141,584 | 141,109 |
| 90% | 90.3% | 127,426 | 127,914 |
| 80% | 81.2% | 113,267 | 114,904 |
| 70% | 70.2% | 99,109 | 99,334 |
| 60% | 59.8% | 84,951 | 84,698 |
| 50% | 49.9% | 70,792 | 70,721 |
| 40% | 39.5% | 56,634 | 55,864 |
| 30% | 29.8% | 42,475 | 42,243 |
| 20% | 19.8% | 28,317 | 27,980 |
| 10% | 10.1% | 14,158 | 14,257 |
| Active Idle | 0 | 0 | |

| Target Load | Actual Load | ssj_ops | |
|---|---|---|---|
| Target | Actual | ||
| Calibration 1 | 138,136 | ||
| Calibration 2 | 139,785 | ||
| Calibration 3 | 138,943 | ||
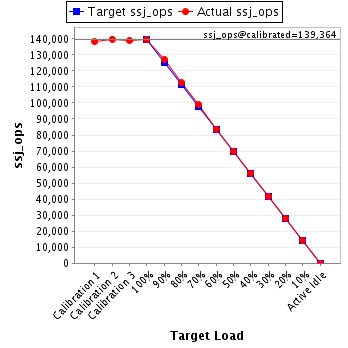
| ssj_ops@calibrated=139,364 | |||
| 100% | 100.0% | 139,364 | 139,416 |
| 90% | 91.1% | 125,428 | 127,026 |
| 80% | 80.7% | 111,491 | 112,516 |
| 70% | 70.9% | 97,555 | 98,844 |
| 60% | 60.1% | 83,618 | 83,743 |
| 50% | 50.1% | 69,682 | 69,889 |
| 40% | 40.3% | 55,746 | 56,189 |
| 30% | 29.9% | 41,809 | 41,712 |
| 20% | 19.9% | 27,873 | 27,720 |
| 10% | 10.3% | 13,936 | 14,381 |
| Active Idle | 0 | 0 | |
| Target Load | Actual Load | ssj_ops | |
|---|---|---|---|
| Target | Actual | ||
| Calibration 1 | 138,507 | ||
| Calibration 2 | 140,156 | ||
| Calibration 3 | 139,202 | ||
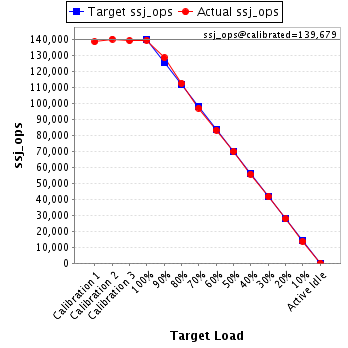
| ssj_ops@calibrated=139,679 | |||
| 100% | 99.9% | 139,679 | 139,473 |
| 90% | 92.0% | 125,711 | 128,550 |
| 80% | 80.6% | 111,743 | 112,606 |
| 70% | 69.5% | 97,775 | 97,066 |
| 60% | 59.6% | 83,807 | 83,257 |
| 50% | 50.1% | 69,840 | 69,930 |
| 40% | 39.8% | 55,872 | 55,635 |
| 30% | 29.8% | 41,904 | 41,660 |
| 20% | 19.8% | 27,936 | 27,724 |
| 10% | 9.8% | 13,968 | 13,725 |
| Active Idle | 0 | 0 | |
| Target Load | Actual Load | ssj_ops | |
|---|---|---|---|
| Target | Actual | ||
| Calibration 1 | 136,243 | ||
| Calibration 2 | 138,052 | ||
| Calibration 3 | 138,487 | ||
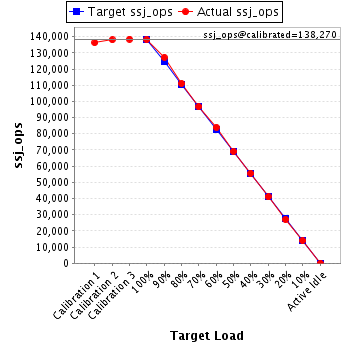
| ssj_ops@calibrated=138,270 | |||
| 100% | 100.0% | 138,270 | 138,203 |
| 90% | 92.0% | 124,443 | 127,230 |
| 80% | 80.3% | 110,616 | 111,076 |
| 70% | 70.0% | 96,789 | 96,724 |
| 60% | 60.7% | 82,962 | 83,974 |
| 50% | 50.0% | 69,135 | 69,187 |
| 40% | 40.2% | 55,308 | 55,595 |
| 30% | 29.7% | 41,481 | 41,060 |
| 20% | 19.6% | 27,654 | 27,072 |
| 10% | 10.1% | 13,827 | 13,954 |
| Active Idle | 0 | 0 | |
| Target Load | Actual Load | ssj_ops | |
|---|---|---|---|
| Target | Actual | ||
| Calibration 1 | 138,756 | ||
| Calibration 2 | 139,314 | ||
| Calibration 3 | 139,304 | ||
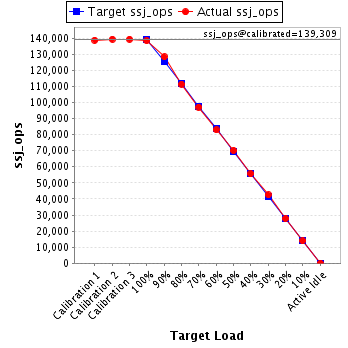
| ssj_ops@calibrated=139,309 | |||
| 100% | 99.3% | 139,309 | 138,318 |
| 90% | 92.1% | 125,378 | 128,332 |
| 80% | 80.0% | 111,447 | 111,413 |
| 70% | 69.7% | 97,516 | 97,124 |
| 60% | 59.5% | 83,585 | 82,922 |
| 50% | 50.4% | 69,654 | 70,196 |
| 40% | 39.9% | 55,723 | 55,551 |
| 30% | 30.5% | 41,793 | 42,507 |
| 20% | 20.0% | 27,862 | 27,801 |
| 10% | 10.0% | 13,931 | 13,920 |
| Active Idle | 0 | 0 | |