
SPECpower_ssj2008
Host 'M915-03' Performance Report
Copyright © 2007-2011 Standard Performance Evaluation Corporation
| Dell Inc. PowerEdge M915 | ssj_ops@100% = 2,242,263 ssj_ops@100% per JVM = 140,141 |
||||
| Test Sponsor: | Dell Inc. | SPEC License #: | 55 | Test Method: | Multi Node |
| Tested By: | Dell Inc. | Test Location: | Round Rock, TX, USA | Test Date: | Oct 29, 2011 |
| Hardware Availability: | Nov-2011 | Software Availability: | Feb-2011 | Publication: | Nov 16, 2011 |
| System Source: | Single Supplier | System Designation: | Server | Power Provisioning: | Line-powered |
| Target Load | Actual Load | ssj_ops | |
|---|---|---|---|
| Target | Actual | ||
| Calibration 1 | 2,217,558 | ||
| Calibration 2 | 2,245,279 | ||
| Calibration 3 | 2,243,500 | ||
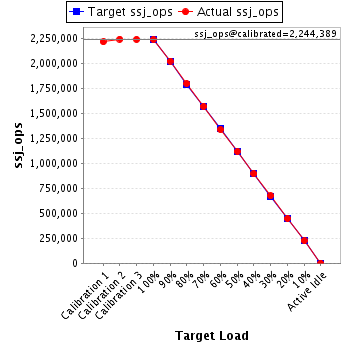
| ssj_ops@calibrated=2,244,389 | |||
| 100% | 99.9% | 2,244,389 | 2,242,263 |
| 90% | 90.3% | 2,019,950 | 2,026,060 |
| 80% | 80.3% | 1,795,511 | 1,801,531 |
| 70% | 70.1% | 1,571,072 | 1,573,780 |
| 60% | 59.7% | 1,346,634 | 1,338,893 |
| 50% | 49.9% | 1,122,195 | 1,120,345 |
| 40% | 39.9% | 897,756 | 895,600 |
| 30% | 30.1% | 673,317 | 675,585 |
| 20% | 20.0% | 448,878 | 447,826 |
| 10% | 10.1% | 224,439 | 225,632 |
| Active Idle | 0 | 0 | |
| Set Identifier: | sut |
| Set Description: | M915 |
| # of Identical Nodes: | 8 |
| Comment: | None |
| Hardware | |
|---|---|
| Hardware Vendor: | Dell Inc. |
| Model: | PowerEdge M915 |
| Form Factor: | Blade |
| CPU Name: | AMD Opteron 6276 (2.30 GHz) |
| CPU Characteristics: | 16 Core, 2.30 GHz, 16 MB L3 Cache |
| CPU Frequency (MHz): | 2300 |
| CPU(s) Enabled: | 64 cores, 4 chips, 16 cores/chip |
| Hardware Threads: | 64 (1 / core) |
| CPU(s) Orderable: | 2,4 chips |
| Primary Cache: | 512 KB I + 256 KB D on chip per chip |
| Secondary Cache: | 16 MB I+D on chip per chip, 2 MB shared / 2 cores |
| Tertiary Cache: | 16 MB I+D on chip per chip, 8MB shared / 8 cores |
| Other Cache: | None |
| Memory Amount (GB): | 64 |
| # and size of DIMM: | 16 x 4096 MB |
| Memory Details: | 4GB 2Rx8 PC3L-10600R ECC RDIMM, Slots A1-A4, B1-B4, C1-C4, D1-D4 populated |
| Power Supply Quantity and Rating (W): | None |
| Power Supply Details: | Shared |
| Disk Drive: | 1 x 50 GB 2.5" SSD SATA (Dell PN X2N7H) |
| Disk Controller: | PERC H200 Modular |
| # and type of Network Interface Cards (NICs) Installed: | 2 x onboard dual-port 1 Gigabit Ethernet |
| NICs Enabled in Firmware / OS / Connected: | 2/2/1 |
| Network Speed (Mbit): | 1000 |
| Keyboard: | None |
| Mouse: | None |
| Monitor: | None |
| Optical Drives: | No |
| Other Hardware: | None |
| Software | |
|---|---|
| Power Management: | Balanced Mode in OS (See Notes) |
| Operating System (OS): | Windows 2008 Server Enterprise x64 Edition |
| OS Version: | R2 SP1 |
| Filesystem: | NTFS |
| JVM Vendor: | IBM Corporation |
| JVM Version: | IBM J9 VM (build 2.4, J2RE 1.6.0 IBM J9 2.4 Windows Server 2008 amd64-64 jvmwa64 60sr5-20090519_35743 (JIT enabled, AOT enabled) |
| JVM Command-line Options: | -Xaggressive -Xcompressedrefs -Xgcpolicy:gencon -Xmn1400m -Xms1875m -Xmx1875m -XlockReservation -Xnoloa -Xlp |
| JVM Affinity: | start /affinity [F, F0, F00, F000, F0000, F00000, F000000, F0000000, F00000000, F000000000, F0000000000, F00000000000, F000000000000, F0000000000000, F00000000000000, F000000000000000] |
| JVM Instances: | 16 |
| JVM Initial Heap (MB): | 1875 |
| JVM Maximum Heap (MB): | 1875 |
| JVM Address Bits: | 64 |
| Boot Firmware Version: | 2.3.0 |
| Management Firmware Version: | iDRAC 3.30 build 17 |
| Workload Version: | SSJ 1.2.9 |
| Director Location: | Controller |
| Other Software: | IBM WebSphere Application Server V7.0 for Windows on x86-64bit |
| JVM Instance | ssj_ops@100% |
|---|---|
| M915-03.001 | 143,335 |
| M915-03.002 | 142,425 |
| M915-03.003 | 141,349 |
| M915-03.004 | 140,014 |
| M915-03.005 | 139,368 |
| M915-03.006 | 141,617 |
| M915-03.007 | 139,018 |
| M915-03.008 | 142,162 |
| M915-03.009 | 138,456 |
| M915-03.010 | 140,241 |
| M915-03.011 | 138,060 |
| M915-03.012 | 138,368 |
| M915-03.013 | 141,139 |
| M915-03.014 | 139,018 |
| M915-03.015 | 137,860 |
| M915-03.016 | 139,833 |
| ssj_ops@100% | 2,242,263 |
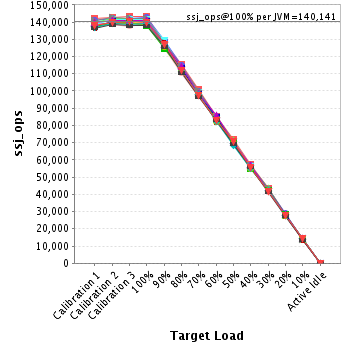
| ssj_ops@100% per JVM | 140,141 |
| Target Load | Actual Load | ssj_ops | |
|---|---|---|---|
| Target | Actual | ||
| Calibration 1 | 142,355 | ||
| Calibration 2 | 142,560 | ||
| Calibration 3 | 143,242 | ||
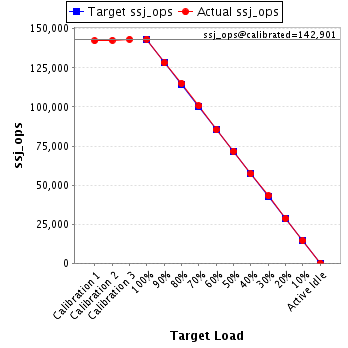
| ssj_ops@calibrated=142,901 | |||
| 100% | 100.3% | 142,901 | 143,335 |
| 90% | 89.7% | 128,611 | 128,206 |
| 80% | 80.6% | 114,321 | 115,170 |
| 70% | 70.4% | 100,031 | 100,620 |
| 60% | 59.7% | 85,741 | 85,359 |
| 50% | 50.2% | 71,451 | 71,720 |
| 40% | 40.0% | 57,160 | 57,101 |
| 30% | 30.2% | 42,870 | 43,141 |
| 20% | 20.0% | 28,580 | 28,593 |
| 10% | 10.1% | 14,290 | 14,497 |
| Active Idle | 0 | 0 | |
| Target Load | Actual Load | ssj_ops | |
|---|---|---|---|
| Target | Actual | ||
| Calibration 1 | 140,897 | ||
| Calibration 2 | 142,345 | ||
| Calibration 3 | 142,094 | ||
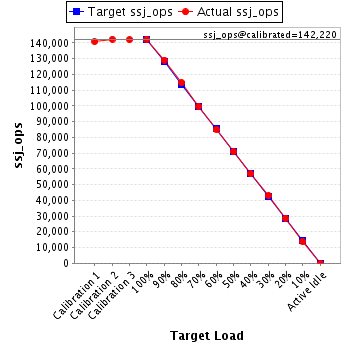
| ssj_ops@calibrated=142,220 | |||
| 100% | 100.1% | 142,220 | 142,425 |
| 90% | 90.8% | 127,998 | 129,155 |
| 80% | 80.7% | 113,776 | 114,812 |
| 70% | 70.1% | 99,554 | 99,693 |
| 60% | 59.8% | 85,332 | 85,034 |
| 50% | 49.9% | 71,110 | 70,924 |
| 40% | 40.0% | 56,888 | 56,845 |
| 30% | 30.2% | 42,666 | 43,003 |
| 20% | 20.2% | 28,444 | 28,719 |
| 10% | 9.6% | 14,222 | 13,724 |
| Active Idle | 0 | 0 | |
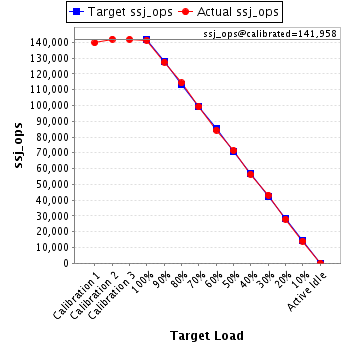
| Target Load | Actual Load | ssj_ops | |
|---|---|---|---|
| Target | Actual | ||
| Calibration 1 | 139,661 | ||
| Calibration 2 | 142,027 | ||
| Calibration 3 | 141,888 | ||
| ssj_ops@calibrated=141,958 | |||
| 100% | 99.6% | 141,958 | 141,349 |
| 90% | 89.8% | 127,762 | 127,533 |
| 80% | 80.5% | 113,566 | 114,255 |
| 70% | 69.9% | 99,370 | 99,275 |
| 60% | 59.5% | 85,175 | 84,412 |
| 50% | 50.3% | 70,979 | 71,433 |
| 40% | 39.7% | 56,783 | 56,320 |
| 30% | 30.4% | 42,587 | 43,202 |
| 20% | 19.7% | 28,392 | 27,959 |
| 10% | 9.9% | 14,196 | 14,077 |
| Active Idle | 0 | 0 | |
| Target Load | Actual Load | ssj_ops | |
|---|---|---|---|
| Target | Actual | ||
| Calibration 1 | 138,185 | ||
| Calibration 2 | 138,947 | ||
| Calibration 3 | 139,869 | ||
| ssj_ops@calibrated=139,408 | |||
| 100% | 100.4% | 139,408 | 140,014 |
| 90% | 89.3% | 125,467 | 124,438 |
| 80% | 80.0% | 111,527 | 111,505 |
| 70% | 70.4% | 97,586 | 98,137 |
| 60% | 59.4% | 83,645 | 82,833 |
| 50% | 49.9% | 69,704 | 69,500 |
| 40% | 39.8% | 55,763 | 55,491 |
| 30% | 30.0% | 41,822 | 41,870 |
| 20% | 20.2% | 27,882 | 28,154 |
| 10% | 9.7% | 13,941 | 13,563 |
| Active Idle | 0 | 0 | |

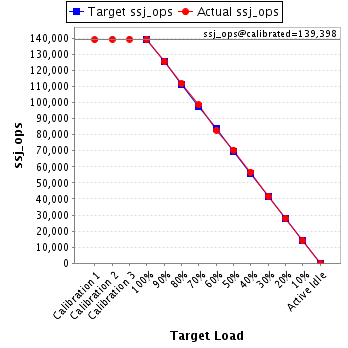
| Target Load | Actual Load | ssj_ops | |
|---|---|---|---|
| Target | Actual | ||
| Calibration 1 | 139,064 | ||
| Calibration 2 | 139,341 | ||
| Calibration 3 | 139,454 | ||
| ssj_ops@calibrated=139,398 | |||
| 100% | 100.0% | 139,398 | 139,368 |
| 90% | 89.9% | 125,458 | 125,370 |
| 80% | 80.2% | 111,518 | 111,738 |
| 70% | 70.7% | 97,578 | 98,581 |
| 60% | 59.4% | 83,639 | 82,870 |
| 50% | 50.6% | 69,699 | 70,479 |
| 40% | 40.6% | 55,759 | 56,628 |
| 30% | 30.0% | 41,819 | 41,753 |
| 20% | 20.0% | 27,880 | 27,909 |
| 10% | 10.1% | 13,940 | 14,041 |
| Active Idle | 0 | 0 | |
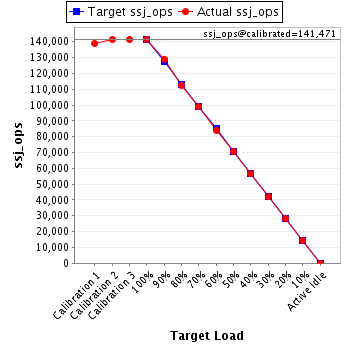
| Target Load | Actual Load | ssj_ops | |
|---|---|---|---|
| Target | Actual | ||
| Calibration 1 | 138,728 | ||
| Calibration 2 | 141,440 | ||
| Calibration 3 | 141,502 | ||
| ssj_ops@calibrated=141,471 | |||
| 100% | 100.1% | 141,471 | 141,617 |
| 90% | 91.2% | 127,324 | 129,061 |
| 80% | 79.6% | 113,177 | 112,541 |
| 70% | 69.9% | 99,029 | 98,951 |
| 60% | 59.3% | 84,882 | 83,909 |
| 50% | 49.8% | 70,735 | 70,506 |
| 40% | 39.9% | 56,588 | 56,430 |
| 30% | 29.6% | 42,441 | 41,881 |
| 20% | 19.8% | 28,294 | 28,015 |
| 10% | 10.0% | 14,147 | 14,216 |
| Active Idle | 0 | 0 | |
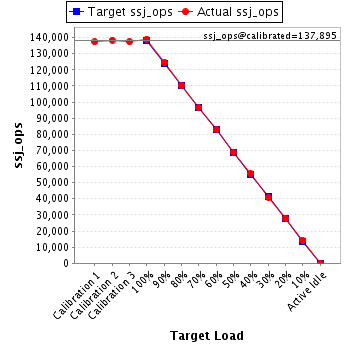
| Target Load | Actual Load | ssj_ops | |
|---|---|---|---|
| Target | Actual | ||
| Calibration 1 | 137,290 | ||
| Calibration 2 | 138,416 | ||
| Calibration 3 | 137,373 | ||
| ssj_ops@calibrated=137,895 | |||
| 100% | 100.8% | 137,895 | 139,018 |
| 90% | 90.3% | 124,105 | 124,577 |
| 80% | 79.8% | 110,316 | 110,063 |
| 70% | 70.0% | 96,526 | 96,533 |
| 60% | 60.2% | 82,737 | 83,033 |
| 50% | 50.0% | 68,947 | 68,965 |
| 40% | 40.4% | 55,158 | 55,695 |
| 30% | 29.6% | 41,368 | 40,835 |
| 20% | 20.2% | 27,579 | 27,882 |
| 10% | 10.3% | 13,789 | 14,195 |
| Active Idle | 0 | 0 | |
| Target Load | Actual Load | ssj_ops | |
|---|---|---|---|
| Target | Actual | ||
| Calibration 1 | 141,070 | ||
| Calibration 2 | 142,441 | ||
| Calibration 3 | 142,297 | ||
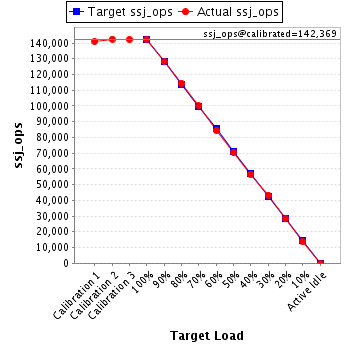
| ssj_ops@calibrated=142,369 | |||
| 100% | 99.9% | 142,369 | 142,162 |
| 90% | 90.1% | 128,132 | 128,261 |
| 80% | 80.4% | 113,895 | 114,440 |
| 70% | 70.3% | 99,658 | 100,019 |
| 60% | 59.4% | 85,421 | 84,507 |
| 50% | 49.5% | 71,184 | 70,452 |
| 40% | 39.8% | 56,948 | 56,657 |
| 30% | 30.4% | 42,711 | 43,285 |
| 20% | 19.8% | 28,474 | 28,237 |
| 10% | 9.8% | 14,237 | 14,019 |
| Active Idle | 0 | 0 | |
| Target Load | Actual Load | ssj_ops | |
|---|---|---|---|
| Target | Actual | ||
| Calibration 1 | 137,142 | ||
| Calibration 2 | 139,650 | ||
| Calibration 3 | 139,315 | ||
| ssj_ops@calibrated=139,483 | |||
| 100% | 99.3% | 139,483 | 138,456 |
| 90% | 91.6% | 125,535 | 127,742 |
| 80% | 80.1% | 111,586 | 111,779 |
| 70% | 70.3% | 97,638 | 98,028 |
| 60% | 59.1% | 83,690 | 82,389 |
| 50% | 49.7% | 69,741 | 69,348 |
| 40% | 39.9% | 55,793 | 55,596 |
| 30% | 30.4% | 41,845 | 42,387 |
| 20% | 19.7% | 27,897 | 27,454 |
| 10% | 9.9% | 13,948 | 13,798 |
| Active Idle | 0 | 0 | |

| Target Load | Actual Load | ssj_ops | |
|---|---|---|---|
| Target | Actual | ||
| Calibration 1 | 137,373 | ||
| Calibration 2 | 140,242 | ||
| Calibration 3 | 140,254 | ||
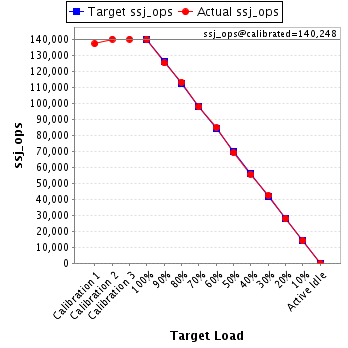
| ssj_ops@calibrated=140,248 | |||
| 100% | 100.0% | 140,248 | 140,241 |
| 90% | 89.4% | 126,223 | 125,351 |
| 80% | 80.8% | 112,198 | 113,307 |
| 70% | 69.8% | 98,174 | 97,882 |
| 60% | 60.5% | 84,149 | 84,781 |
| 50% | 49.4% | 70,124 | 69,275 |
| 40% | 39.8% | 56,099 | 55,825 |
| 30% | 30.2% | 42,074 | 42,362 |
| 20% | 19.8% | 28,050 | 27,766 |
| 10% | 10.1% | 14,025 | 14,119 |
| Active Idle | 0 | 0 | |
| Target Load | Actual Load | ssj_ops | |
|---|---|---|---|
| Target | Actual | ||
| Calibration 1 | 137,540 | ||
| Calibration 2 | 139,461 | ||
| Calibration 3 | 139,675 | ||
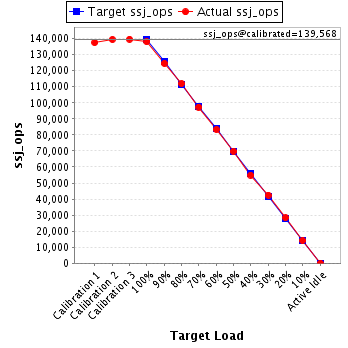
| ssj_ops@calibrated=139,568 | |||
| 100% | 98.9% | 139,568 | 138,060 |
| 90% | 89.3% | 125,611 | 124,604 |
| 80% | 80.2% | 111,655 | 111,966 |
| 70% | 69.8% | 97,698 | 97,388 |
| 60% | 59.8% | 83,741 | 83,402 |
| 50% | 50.1% | 69,784 | 69,932 |
| 40% | 39.4% | 55,827 | 54,932 |
| 30% | 30.5% | 41,870 | 42,519 |
| 20% | 20.3% | 27,914 | 28,271 |
| 10% | 10.2% | 13,957 | 14,219 |
| Active Idle | 0 | 0 | |
| Target Load | Actual Load | ssj_ops | |
|---|---|---|---|
| Target | Actual | ||
| Calibration 1 | 137,828 | ||
| Calibration 2 | 139,619 | ||
| Calibration 3 | 139,042 | ||
| ssj_ops@calibrated=139,330 | |||
| 100% | 99.3% | 139,330 | 138,368 |
| 90% | 90.2% | 125,397 | 125,627 |
| 80% | 80.1% | 111,464 | 111,560 |
| 70% | 70.1% | 97,531 | 97,691 |
| 60% | 59.1% | 83,598 | 82,279 |
| 50% | 50.0% | 69,665 | 69,661 |
| 40% | 39.4% | 55,732 | 54,924 |
| 30% | 30.2% | 41,799 | 42,101 |
| 20% | 19.8% | 27,866 | 27,585 |
| 10% | 10.4% | 13,933 | 14,461 |
| Active Idle | 0 | 0 | |

| Target Load | Actual Load | ssj_ops | |
|---|---|---|---|
| Target | Actual | ||
| Calibration 1 | 139,655 | ||
| Calibration 2 | 141,184 | ||
| Calibration 3 | 141,123 | ||
| ssj_ops@calibrated=141,153 | |||
| 100% | 100.0% | 141,153 | 141,139 |
| 90% | 90.0% | 127,038 | 127,035 |
| 80% | 80.8% | 112,923 | 114,026 |
| 70% | 69.9% | 98,807 | 98,710 |
| 60% | 60.7% | 84,692 | 85,724 |
| 50% | 49.7% | 70,577 | 70,213 |
| 40% | 40.3% | 56,461 | 56,856 |
| 30% | 29.9% | 42,346 | 42,140 |
| 20% | 20.0% | 28,231 | 28,296 |
| 10% | 10.3% | 14,115 | 14,497 |
| Active Idle | 0 | 0 | |

| Target Load | Actual Load | ssj_ops | |
|---|---|---|---|
| Target | Actual | ||
| Calibration 1 | 136,578 | ||
| Calibration 2 | 139,369 | ||
| Calibration 3 | 138,315 | ||
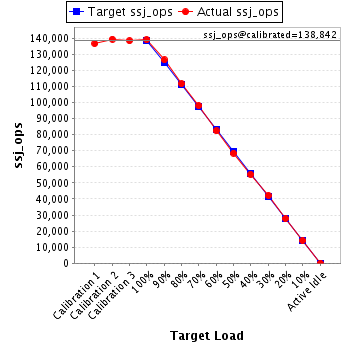
| ssj_ops@calibrated=138,842 | |||
| 100% | 100.1% | 138,842 | 139,018 |
| 90% | 91.1% | 124,958 | 126,463 |
| 80% | 80.4% | 111,074 | 111,580 |
| 70% | 70.6% | 97,189 | 98,015 |
| 60% | 59.3% | 83,305 | 82,339 |
| 50% | 49.3% | 69,421 | 68,459 |
| 40% | 39.7% | 55,537 | 55,187 |
| 30% | 30.3% | 41,653 | 42,111 |
| 20% | 20.0% | 27,768 | 27,722 |
| 10% | 10.2% | 13,884 | 14,131 |
| Active Idle | 0 | 0 | |
| Target Load | Actual Load | ssj_ops | |
|---|---|---|---|
| Target | Actual | ||
| Calibration 1 | 136,324 | ||
| Calibration 2 | 138,374 | ||
| Calibration 3 | 137,945 | ||
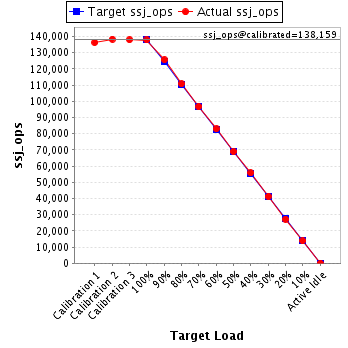
| ssj_ops@calibrated=138,159 | |||
| 100% | 99.8% | 138,159 | 137,860 |
| 90% | 91.0% | 124,343 | 125,666 |
| 80% | 80.1% | 110,527 | 110,697 |
| 70% | 70.0% | 96,711 | 96,758 |
| 60% | 60.0% | 82,895 | 82,946 |
| 50% | 49.9% | 69,080 | 68,993 |
| 40% | 40.3% | 55,264 | 55,736 |
| 30% | 29.9% | 41,448 | 41,267 |
| 20% | 19.8% | 27,632 | 27,290 |
| 10% | 10.0% | 13,816 | 13,790 |
| Active Idle | 0 | 0 | |
| Target Load | Actual Load | ssj_ops | |
|---|---|---|---|
| Target | Actual | ||
| Calibration 1 | 137,868 | ||
| Calibration 2 | 139,862 | ||
| Calibration 3 | 140,112 | ||
| ssj_ops@calibrated=139,987 | |||
| 100% | 99.9% | 139,987 | 139,833 |
| 90% | 90.7% | 125,988 | 126,971 |
| 80% | 80.1% | 111,990 | 112,091 |
| 70% | 69.6% | 97,991 | 97,499 |
| 60% | 59.3% | 83,992 | 83,077 |
| 50% | 50.4% | 69,993 | 70,484 |
| 40% | 39.6% | 55,995 | 55,377 |
| 30% | 29.8% | 41,996 | 41,729 |
| 20% | 20.0% | 27,997 | 27,972 |
| 10% | 10.2% | 13,999 | 14,284 |
| Active Idle | 0 | 0 | |
