
SPECpower_ssj2008
Host 'M915-04' Performance Report
Copyright © 2007-2011 Standard Performance Evaluation Corporation
| Dell Inc. PowerEdge M915 | ssj_ops@100% = 2,236,262 ssj_ops@100% per JVM = 139,766 |
||||
| Test Sponsor: | Dell Inc. | SPEC License #: | 55 | Test Method: | Multi Node |
| Tested By: | Dell Inc. | Test Location: | Round Rock, TX, USA | Test Date: | Oct 29, 2011 |
| Hardware Availability: | Nov-2011 | Software Availability: | Feb-2011 | Publication: | Nov 16, 2011 |
| System Source: | Single Supplier | System Designation: | Server | Power Provisioning: | Line-powered |
| Target Load | Actual Load | ssj_ops | |
|---|---|---|---|
| Target | Actual | ||
| Calibration 1 | 2,216,506 | ||
| Calibration 2 | 2,243,247 | ||
| Calibration 3 | 2,243,814 | ||
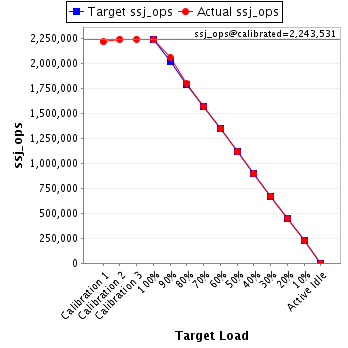
| ssj_ops@calibrated=2,243,531 | |||
| 100% | 99.7% | 2,243,531 | 2,236,262 |
| 90% | 91.7% | 2,019,177 | 2,057,523 |
| 80% | 80.2% | 1,794,824 | 1,798,431 |
| 70% | 69.9% | 1,570,471 | 1,568,475 |
| 60% | 60.0% | 1,346,118 | 1,345,113 |
| 50% | 50.0% | 1,121,765 | 1,121,192 |
| 40% | 39.9% | 897,412 | 896,145 |
| 30% | 30.0% | 673,059 | 672,144 |
| 20% | 20.0% | 448,706 | 449,735 |
| 10% | 10.0% | 224,353 | 224,849 |
| Active Idle | 0 | 0 | |
| Set Identifier: | sut |
| Set Description: | M915 |
| # of Identical Nodes: | 8 |
| Comment: | None |
| Hardware | |
|---|---|
| Hardware Vendor: | Dell Inc. |
| Model: | PowerEdge M915 |
| Form Factor: | Blade |
| CPU Name: | AMD Opteron 6276 (2.30 GHz) |
| CPU Characteristics: | 16 Core, 2.30 GHz, 16 MB L3 Cache |
| CPU Frequency (MHz): | 2300 |
| CPU(s) Enabled: | 64 cores, 4 chips, 16 cores/chip |
| Hardware Threads: | 64 (1 / core) |
| CPU(s) Orderable: | 2,4 chips |
| Primary Cache: | 512 KB I + 256 KB D on chip per chip |
| Secondary Cache: | 16 MB I+D on chip per chip, 2 MB shared / 2 cores |
| Tertiary Cache: | 16 MB I+D on chip per chip, 8MB shared / 8 cores |
| Other Cache: | None |
| Memory Amount (GB): | 64 |
| # and size of DIMM: | 16 x 4096 MB |
| Memory Details: | 4GB 2Rx8 PC3L-10600R ECC RDIMM, Slots A1-A4, B1-B4, C1-C4, D1-D4 populated |
| Power Supply Quantity and Rating (W): | None |
| Power Supply Details: | Shared |
| Disk Drive: | 1 x 50 GB 2.5" SSD SATA (Dell PN X2N7H) |
| Disk Controller: | PERC H200 Modular |
| # and type of Network Interface Cards (NICs) Installed: | 2 x onboard dual-port 1 Gigabit Ethernet |
| NICs Enabled in Firmware / OS / Connected: | 2/2/1 |
| Network Speed (Mbit): | 1000 |
| Keyboard: | None |
| Mouse: | None |
| Monitor: | None |
| Optical Drives: | No |
| Other Hardware: | None |
| Software | |
|---|---|
| Power Management: | Balanced Mode in OS (See Notes) |
| Operating System (OS): | Windows 2008 Server Enterprise x64 Edition |
| OS Version: | R2 SP1 |
| Filesystem: | NTFS |
| JVM Vendor: | IBM Corporation |
| JVM Version: | IBM J9 VM (build 2.4, J2RE 1.6.0 IBM J9 2.4 Windows Server 2008 amd64-64 jvmwa64 60sr5-20090519_35743 (JIT enabled, AOT enabled) |
| JVM Command-line Options: | -Xaggressive -Xcompressedrefs -Xgcpolicy:gencon -Xmn1400m -Xms1875m -Xmx1875m -XlockReservation -Xnoloa -Xlp |
| JVM Affinity: | start /affinity [F, F0, F00, F000, F0000, F00000, F000000, F0000000, F00000000, F000000000, F0000000000, F00000000000, F000000000000, F0000000000000, F00000000000000, F000000000000000] |
| JVM Instances: | 16 |
| JVM Initial Heap (MB): | 1875 |
| JVM Maximum Heap (MB): | 1875 |
| JVM Address Bits: | 64 |
| Boot Firmware Version: | 2.3.0 |
| Management Firmware Version: | iDRAC 3.30 build 17 |
| Workload Version: | SSJ 1.2.9 |
| Director Location: | Controller |
| Other Software: | IBM WebSphere Application Server V7.0 for Windows on x86-64bit |
| JVM Instance | ssj_ops@100% |
|---|---|
| M915-04.001 | 140,637 |
| M915-04.002 | 140,980 |
| M915-04.003 | 139,500 |
| M915-04.004 | 138,511 |
| M915-04.005 | 138,127 |
| M915-04.006 | 138,032 |
| M915-04.007 | 138,540 |
| M915-04.008 | 138,457 |
| M915-04.009 | 141,297 |
| M915-04.010 | 141,004 |
| M915-04.011 | 139,336 |
| M915-04.012 | 138,387 |
| M915-04.013 | 141,167 |
| M915-04.014 | 141,706 |
| M915-04.015 | 139,583 |
| M915-04.016 | 140,998 |
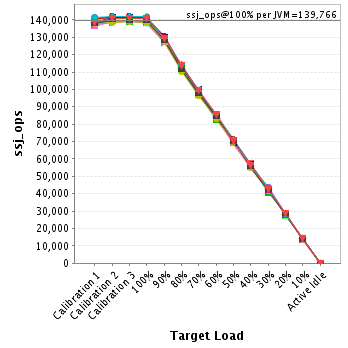
| ssj_ops@100% | 2,236,262 |
| ssj_ops@100% per JVM | 139,766 |
| Target Load | Actual Load | ssj_ops | |
|---|---|---|---|
| Target | Actual | ||
| Calibration 1 | 140,250 | ||
| Calibration 2 | 141,139 | ||
| Calibration 3 | 141,169 | ||
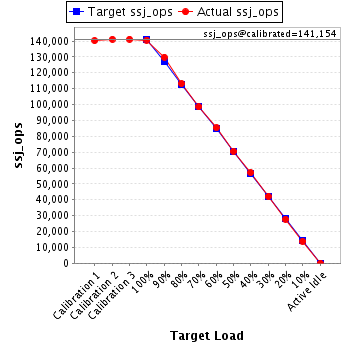
| ssj_ops@calibrated=141,154 | |||
| 100% | 99.6% | 141,154 | 140,637 |
| 90% | 92.0% | 127,039 | 129,867 |
| 80% | 80.2% | 112,923 | 113,158 |
| 70% | 69.8% | 98,808 | 98,483 |
| 60% | 60.5% | 84,692 | 85,382 |
| 50% | 50.0% | 70,577 | 70,630 |
| 40% | 40.5% | 56,462 | 57,127 |
| 30% | 29.9% | 42,346 | 42,152 |
| 20% | 19.7% | 28,231 | 27,785 |
| 10% | 9.8% | 14,115 | 13,871 |
| Active Idle | 0 | 0 | |
| Target Load | Actual Load | ssj_ops | |
|---|---|---|---|
| Target | Actual | ||
| Calibration 1 | 141,462 | ||
| Calibration 2 | 141,132 | ||
| Calibration 3 | 141,631 | ||
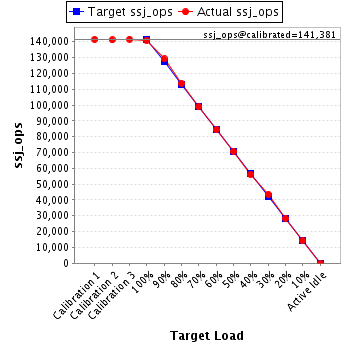
| ssj_ops@calibrated=141,381 | |||
| 100% | 99.7% | 141,381 | 140,980 |
| 90% | 91.3% | 127,243 | 129,113 |
| 80% | 80.4% | 113,105 | 113,734 |
| 70% | 69.9% | 98,967 | 98,839 |
| 60% | 59.7% | 84,829 | 84,467 |
| 50% | 50.1% | 70,691 | 70,783 |
| 40% | 39.7% | 56,553 | 56,179 |
| 30% | 30.8% | 42,414 | 43,502 |
| 20% | 20.1% | 28,276 | 28,350 |
| 10% | 10.0% | 14,138 | 14,190 |
| Active Idle | 0 | 0 | |
| Target Load | Actual Load | ssj_ops | |
|---|---|---|---|
| Target | Actual | ||
| Calibration 1 | 137,498 | ||
| Calibration 2 | 139,714 | ||
| Calibration 3 | 139,883 | ||
| ssj_ops@calibrated=139,799 | |||
| 100% | 99.8% | 139,799 | 139,500 |
| 90% | 91.7% | 125,819 | 128,176 |
| 80% | 80.4% | 111,839 | 112,390 |
| 70% | 70.1% | 97,859 | 97,971 |
| 60% | 60.4% | 83,879 | 84,384 |
| 50% | 50.0% | 69,899 | 69,863 |
| 40% | 39.7% | 55,919 | 55,475 |
| 30% | 29.9% | 41,940 | 41,844 |
| 20% | 19.8% | 27,960 | 27,702 |
| 10% | 10.0% | 13,980 | 13,991 |
| Active Idle | 0 | 0 | |

| Target Load | Actual Load | ssj_ops | |
|---|---|---|---|
| Target | Actual | ||
| Calibration 1 | 137,866 | ||
| Calibration 2 | 140,131 | ||
| Calibration 3 | 138,871 | ||
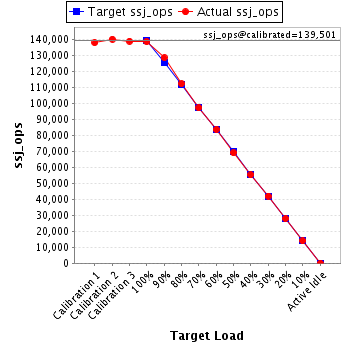
| ssj_ops@calibrated=139,501 | |||
| 100% | 99.3% | 139,501 | 138,511 |
| 90% | 92.1% | 125,551 | 128,523 |
| 80% | 80.4% | 111,601 | 112,171 |
| 70% | 69.7% | 97,651 | 97,203 |
| 60% | 60.0% | 83,701 | 83,741 |
| 50% | 49.5% | 69,751 | 69,030 |
| 40% | 39.6% | 55,801 | 55,222 |
| 30% | 30.1% | 41,850 | 42,031 |
| 20% | 20.0% | 27,900 | 27,944 |
| 10% | 10.0% | 13,950 | 13,962 |
| Active Idle | 0 | 0 | |
| Target Load | Actual Load | ssj_ops | |
|---|---|---|---|
| Target | Actual | ||
| Calibration 1 | 136,099 | ||
| Calibration 2 | 139,119 | ||
| Calibration 3 | 139,493 | ||
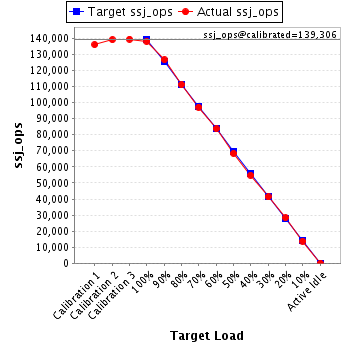
| ssj_ops@calibrated=139,306 | |||
| 100% | 99.2% | 139,306 | 138,127 |
| 90% | 90.9% | 125,375 | 126,698 |
| 80% | 79.8% | 111,445 | 111,100 |
| 70% | 69.8% | 97,514 | 97,176 |
| 60% | 60.1% | 83,584 | 83,736 |
| 50% | 49.1% | 69,653 | 68,407 |
| 40% | 39.3% | 55,722 | 54,812 |
| 30% | 29.6% | 41,792 | 41,251 |
| 20% | 20.3% | 27,861 | 28,253 |
| 10% | 9.9% | 13,931 | 13,800 |
| Active Idle | 0 | 0 | |
| Target Load | Actual Load | ssj_ops | |
|---|---|---|---|
| Target | Actual | ||
| Calibration 1 | 137,942 | ||
| Calibration 2 | 139,353 | ||
| Calibration 3 | 139,630 | ||
| ssj_ops@calibrated=139,491 | |||
| 100% | 99.0% | 139,491 | 138,032 |
| 90% | 91.8% | 125,542 | 127,997 |
| 80% | 80.0% | 111,593 | 111,618 |
| 70% | 69.2% | 97,644 | 96,536 |
| 60% | 60.2% | 83,695 | 83,984 |
| 50% | 49.9% | 69,746 | 69,595 |
| 40% | 40.3% | 55,797 | 56,221 |
| 30% | 29.6% | 41,847 | 41,318 |
| 20% | 20.0% | 27,898 | 27,952 |
| 10% | 10.0% | 13,949 | 13,914 |
| Active Idle | 0 | 0 | |

| Target Load | Actual Load | ssj_ops | |
|---|---|---|---|
| Target | Actual | ||
| Calibration 1 | 136,852 | ||
| Calibration 2 | 138,842 | ||
| Calibration 3 | 139,081 | ||
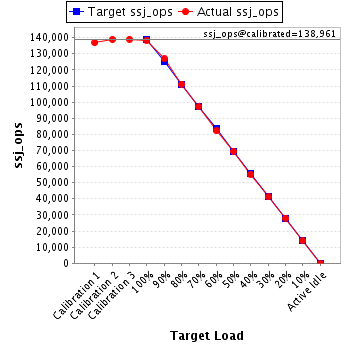
| ssj_ops@calibrated=138,961 | |||
| 100% | 99.7% | 138,961 | 138,540 |
| 90% | 91.4% | 125,065 | 126,962 |
| 80% | 80.1% | 111,169 | 111,239 |
| 70% | 70.0% | 97,273 | 97,204 |
| 60% | 59.2% | 83,377 | 82,248 |
| 50% | 50.0% | 69,481 | 69,500 |
| 40% | 39.8% | 55,585 | 55,313 |
| 30% | 29.6% | 41,688 | 41,156 |
| 20% | 20.2% | 27,792 | 28,059 |
| 10% | 10.0% | 13,896 | 13,885 |
| Active Idle | 0 | 0 | |
| Target Load | Actual Load | ssj_ops | |
|---|---|---|---|
| Target | Actual | ||
| Calibration 1 | 137,569 | ||
| Calibration 2 | 138,749 | ||
| Calibration 3 | 139,142 | ||
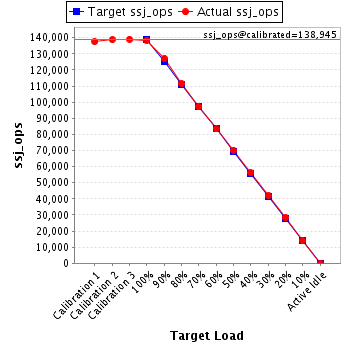
| ssj_ops@calibrated=138,945 | |||
| 100% | 99.6% | 138,945 | 138,457 |
| 90% | 91.6% | 125,051 | 127,211 |
| 80% | 80.4% | 111,156 | 111,654 |
| 70% | 70.0% | 97,262 | 97,236 |
| 60% | 60.0% | 83,367 | 83,391 |
| 50% | 50.5% | 69,473 | 70,231 |
| 40% | 40.4% | 55,578 | 56,086 |
| 30% | 30.1% | 41,684 | 41,850 |
| 20% | 20.4% | 27,789 | 28,285 |
| 10% | 10.0% | 13,895 | 13,960 |
| Active Idle | 0 | 0 | |
| Target Load | Actual Load | ssj_ops | |
|---|---|---|---|
| Target | Actual | ||
| Calibration 1 | 139,983 | ||
| Calibration 2 | 142,020 | ||
| Calibration 3 | 141,779 | ||
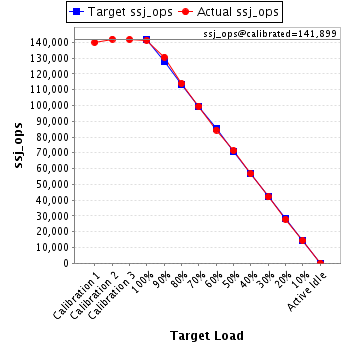
| ssj_ops@calibrated=141,899 | |||
| 100% | 99.6% | 141,899 | 141,297 |
| 90% | 92.1% | 127,709 | 130,654 |
| 80% | 80.3% | 113,520 | 113,987 |
| 70% | 70.1% | 99,330 | 99,476 |
| 60% | 59.5% | 85,140 | 84,436 |
| 50% | 50.3% | 70,950 | 71,360 |
| 40% | 39.9% | 56,760 | 56,686 |
| 30% | 29.6% | 42,570 | 42,023 |
| 20% | 19.6% | 28,380 | 27,867 |
| 10% | 10.2% | 14,190 | 14,411 |
| Active Idle | 0 | 0 | |
| Target Load | Actual Load | ssj_ops | |
|---|---|---|---|
| Target | Actual | ||
| Calibration 1 | 138,391 | ||
| Calibration 2 | 141,073 | ||
| Calibration 3 | 141,148 | ||
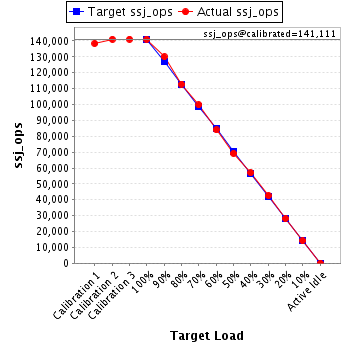
| ssj_ops@calibrated=141,111 | |||
| 100% | 99.9% | 141,111 | 141,004 |
| 90% | 92.2% | 126,999 | 130,036 |
| 80% | 80.0% | 112,888 | 112,884 |
| 70% | 70.7% | 98,777 | 99,790 |
| 60% | 59.5% | 84,666 | 84,020 |
| 50% | 49.0% | 70,555 | 69,179 |
| 40% | 40.4% | 56,444 | 56,952 |
| 30% | 30.2% | 42,333 | 42,563 |
| 20% | 19.9% | 28,222 | 28,103 |
| 10% | 10.1% | 14,111 | 14,216 |
| Active Idle | 0 | 0 | |
| Target Load | Actual Load | ssj_ops | |
|---|---|---|---|
| Target | Actual | ||
| Calibration 1 | 138,682 | ||
| Calibration 2 | 139,895 | ||
| Calibration 3 | 138,862 | ||
| ssj_ops@calibrated=139,378 | |||
| 100% | 100.0% | 139,378 | 139,336 |
| 90% | 92.3% | 125,441 | 128,671 |
| 80% | 79.8% | 111,503 | 111,218 |
| 70% | 70.1% | 97,565 | 97,757 |
| 60% | 59.2% | 83,627 | 82,579 |
| 50% | 50.6% | 69,689 | 70,459 |
| 40% | 40.0% | 55,751 | 55,734 |
| 30% | 29.3% | 41,814 | 40,907 |
| 20% | 20.6% | 27,876 | 28,735 |
| 10% | 10.3% | 13,938 | 14,305 |
| Active Idle | 0 | 0 | |

| Target Load | Actual Load | ssj_ops | |
|---|---|---|---|
| Target | Actual | ||
| Calibration 1 | 137,957 | ||
| Calibration 2 | 138,654 | ||
| Calibration 3 | 138,930 | ||
| ssj_ops@calibrated=138,792 | |||
| 100% | 99.7% | 138,792 | 138,387 |
| 90% | 92.0% | 124,913 | 127,726 |
| 80% | 79.5% | 111,034 | 110,324 |
| 70% | 69.5% | 97,154 | 96,530 |
| 60% | 60.0% | 83,275 | 83,333 |
| 50% | 50.3% | 69,396 | 69,770 |
| 40% | 39.8% | 55,517 | 55,296 |
| 30% | 30.1% | 41,638 | 41,721 |
| 20% | 20.0% | 27,758 | 27,802 |
| 10% | 10.1% | 13,879 | 13,964 |
| Active Idle | 0 | 0 | |

| Target Load | Actual Load | ssj_ops | |
|---|---|---|---|
| Target | Actual | ||
| Calibration 1 | 138,457 | ||
| Calibration 2 | 140,745 | ||
| Calibration 3 | 141,624 | ||
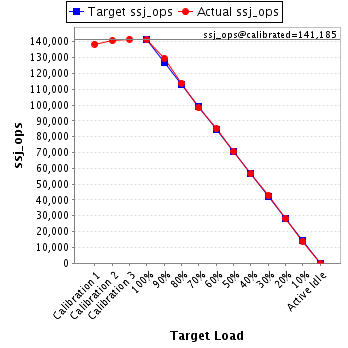
| ssj_ops@calibrated=141,185 | |||
| 100% | 100.0% | 141,185 | 141,167 |
| 90% | 91.7% | 127,066 | 129,447 |
| 80% | 80.6% | 112,948 | 113,856 |
| 70% | 69.6% | 98,829 | 98,254 |
| 60% | 60.2% | 84,711 | 85,052 |
| 50% | 50.0% | 70,592 | 70,652 |
| 40% | 40.1% | 56,474 | 56,584 |
| 30% | 30.2% | 42,355 | 42,682 |
| 20% | 19.9% | 28,237 | 28,083 |
| 10% | 9.9% | 14,118 | 14,018 |
| Active Idle | 0 | 0 | |
| Target Load | Actual Load | ssj_ops | |
|---|---|---|---|
| Target | Actual | ||
| Calibration 1 | 141,470 | ||
| Calibration 2 | 141,944 | ||
| Calibration 3 | 141,987 | ||
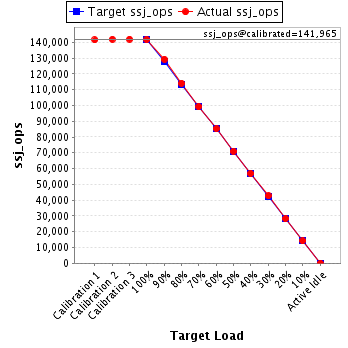
| ssj_ops@calibrated=141,965 | |||
| 100% | 99.8% | 141,965 | 141,706 |
| 90% | 91.1% | 127,769 | 129,298 |
| 80% | 80.4% | 113,572 | 114,124 |
| 70% | 69.9% | 99,376 | 99,177 |
| 60% | 60.0% | 85,179 | 85,210 |
| 50% | 50.0% | 70,983 | 71,039 |
| 40% | 40.1% | 56,786 | 56,901 |
| 30% | 30.1% | 42,590 | 42,725 |
| 20% | 19.9% | 28,393 | 28,235 |
| 10% | 10.0% | 14,197 | 14,151 |
| Active Idle | 0 | 0 | |
| Target Load | Actual Load | ssj_ops | |
|---|---|---|---|
| Target | Actual | ||
| Calibration 1 | 137,772 | ||
| Calibration 2 | 139,846 | ||
| Calibration 3 | 139,629 | ||
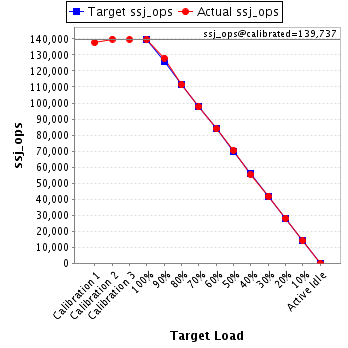
| ssj_ops@calibrated=139,737 | |||
| 100% | 99.9% | 139,737 | 139,583 |
| 90% | 91.6% | 125,763 | 128,018 |
| 80% | 79.7% | 111,790 | 111,399 |
| 70% | 69.8% | 97,816 | 97,574 |
| 60% | 60.0% | 83,842 | 83,853 |
| 50% | 50.4% | 69,869 | 70,469 |
| 40% | 39.6% | 55,895 | 55,324 |
| 30% | 30.0% | 41,921 | 41,861 |
| 20% | 20.2% | 27,947 | 28,193 |
| 10% | 10.1% | 13,974 | 14,090 |
| Active Idle | 0 | 0 | |
| Target Load | Actual Load | ssj_ops | |
|---|---|---|---|
| Target | Actual | ||
| Calibration 1 | 138,255 | ||
| Calibration 2 | 140,891 | ||
| Calibration 3 | 140,957 | ||
| ssj_ops@calibrated=140,924 | |||
| 100% | 100.1% | 140,924 | 140,998 |
| 90% | 91.6% | 126,831 | 129,126 |
| 80% | 80.6% | 112,739 | 113,576 |
| 70% | 70.4% | 98,646 | 99,270 |
| 60% | 60.5% | 84,554 | 85,297 |
| 50% | 49.8% | 70,462 | 70,224 |
| 40% | 39.9% | 56,369 | 56,234 |
| 30% | 30.2% | 42,277 | 42,558 |
| 20% | 20.1% | 28,185 | 28,387 |
| 10% | 10.0% | 14,092 | 14,122 |
| Active Idle | 0 | 0 | |
