
SPECpower_ssj2008
Host 'M915-05' Performance Report
Copyright © 2007-2011 Standard Performance Evaluation Corporation
| Dell Inc. PowerEdge M915 | ssj_ops@100% = 2,232,998 ssj_ops@100% per JVM = 139,562 |
||||
| Test Sponsor: | Dell Inc. | SPEC License #: | 55 | Test Method: | Multi Node |
| Tested By: | Dell Inc. | Test Location: | Round Rock, TX, USA | Test Date: | Oct 29, 2011 |
| Hardware Availability: | Nov-2011 | Software Availability: | Feb-2011 | Publication: | Nov 16, 2011 |
| System Source: | Single Supplier | System Designation: | Server | Power Provisioning: | Line-powered |
| Target Load | Actual Load | ssj_ops | |
|---|---|---|---|
| Target | Actual | ||
| Calibration 1 | 2,213,508 | ||
| Calibration 2 | 2,239,568 | ||
| Calibration 3 | 2,238,946 | ||
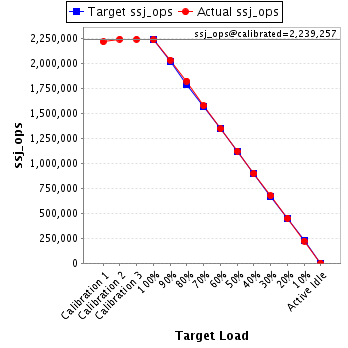
| ssj_ops@calibrated=2,239,257 | |||
| 100% | 99.7% | 2,239,257 | 2,232,998 |
| 90% | 90.7% | 2,015,331 | 2,031,279 |
| 80% | 81.3% | 1,791,405 | 1,819,763 |
| 70% | 70.3% | 1,567,480 | 1,573,646 |
| 60% | 60.0% | 1,343,554 | 1,343,455 |
| 50% | 50.0% | 1,119,628 | 1,120,722 |
| 40% | 40.0% | 895,703 | 895,522 |
| 30% | 30.1% | 671,777 | 672,941 |
| 20% | 20.1% | 447,851 | 450,526 |
| 10% | 9.9% | 223,926 | 222,127 |
| Active Idle | 0 | 0 | |
| Set Identifier: | sut |
| Set Description: | M915 |
| # of Identical Nodes: | 8 |
| Comment: | None |
| Hardware | |
|---|---|
| Hardware Vendor: | Dell Inc. |
| Model: | PowerEdge M915 |
| Form Factor: | Blade |
| CPU Name: | AMD Opteron 6276 (2.30 GHz) |
| CPU Characteristics: | 16 Core, 2.30 GHz, 16 MB L3 Cache |
| CPU Frequency (MHz): | 2300 |
| CPU(s) Enabled: | 64 cores, 4 chips, 16 cores/chip |
| Hardware Threads: | 64 (1 / core) |
| CPU(s) Orderable: | 2,4 chips |
| Primary Cache: | 512 KB I + 256 KB D on chip per chip |
| Secondary Cache: | 16 MB I+D on chip per chip, 2 MB shared / 2 cores |
| Tertiary Cache: | 16 MB I+D on chip per chip, 8MB shared / 8 cores |
| Other Cache: | None |
| Memory Amount (GB): | 64 |
| # and size of DIMM: | 16 x 4096 MB |
| Memory Details: | 4GB 2Rx8 PC3L-10600R ECC RDIMM, Slots A1-A4, B1-B4, C1-C4, D1-D4 populated |
| Power Supply Quantity and Rating (W): | None |
| Power Supply Details: | Shared |
| Disk Drive: | 1 x 50 GB 2.5" SSD SATA (Dell PN X2N7H) |
| Disk Controller: | PERC H200 Modular |
| # and type of Network Interface Cards (NICs) Installed: | 2 x onboard dual-port 1 Gigabit Ethernet |
| NICs Enabled in Firmware / OS / Connected: | 2/2/1 |
| Network Speed (Mbit): | 1000 |
| Keyboard: | None |
| Mouse: | None |
| Monitor: | None |
| Optical Drives: | No |
| Other Hardware: | None |
| Software | |
|---|---|
| Power Management: | Balanced Mode in OS (See Notes) |
| Operating System (OS): | Windows 2008 Server Enterprise x64 Edition |
| OS Version: | R2 SP1 |
| Filesystem: | NTFS |
| JVM Vendor: | IBM Corporation |
| JVM Version: | IBM J9 VM (build 2.4, J2RE 1.6.0 IBM J9 2.4 Windows Server 2008 amd64-64 jvmwa64 60sr5-20090519_35743 (JIT enabled, AOT enabled) |
| JVM Command-line Options: | -Xaggressive -Xcompressedrefs -Xgcpolicy:gencon -Xmn1400m -Xms1875m -Xmx1875m -XlockReservation -Xnoloa -Xlp |
| JVM Affinity: | start /affinity [F, F0, F00, F000, F0000, F00000, F000000, F0000000, F00000000, F000000000, F0000000000, F00000000000, F000000000000, F0000000000000, F00000000000000, F000000000000000] |
| JVM Instances: | 16 |
| JVM Initial Heap (MB): | 1875 |
| JVM Maximum Heap (MB): | 1875 |
| JVM Address Bits: | 64 |
| Boot Firmware Version: | 2.3.0 |
| Management Firmware Version: | iDRAC 3.30 build 17 |
| Workload Version: | SSJ 1.2.9 |
| Director Location: | Controller |
| Other Software: | IBM WebSphere Application Server V7.0 for Windows on x86-64bit |
| JVM Instance | ssj_ops@100% |
|---|---|
| M915-05.001 | 140,950 |
| M915-05.002 | 140,837 |
| M915-05.003 | 138,633 |
| M915-05.004 | 140,194 |
| M915-05.005 | 137,886 |
| M915-05.006 | 139,420 |
| M915-05.007 | 141,405 |
| M915-05.008 | 141,454 |
| M915-05.009 | 140,015 |
| M915-05.010 | 139,842 |
| M915-05.011 | 138,141 |
| M915-05.012 | 139,194 |
| M915-05.013 | 139,771 |
| M915-05.014 | 137,805 |
| M915-05.015 | 137,976 |
| M915-05.016 | 139,476 |
| ssj_ops@100% | 2,232,998 |
| ssj_ops@100% per JVM | 139,562 |

| Target Load | Actual Load | ssj_ops | |
|---|---|---|---|
| Target | Actual | ||
| Calibration 1 | 140,128 | ||
| Calibration 2 | 140,298 | ||
| Calibration 3 | 140,654 | ||
| ssj_ops@calibrated=140,476 | |||
| 100% | 100.3% | 140,476 | 140,950 |
| 90% | 90.4% | 126,428 | 126,959 |
| 80% | 81.0% | 112,381 | 113,786 |
| 70% | 70.6% | 98,333 | 99,232 |
| 60% | 60.0% | 84,285 | 84,264 |
| 50% | 50.2% | 70,238 | 70,578 |
| 40% | 40.1% | 56,190 | 56,275 |
| 30% | 30.1% | 42,143 | 42,269 |
| 20% | 20.1% | 28,095 | 28,289 |
| 10% | 9.8% | 14,048 | 13,806 |
| Active Idle | 0 | 0 | |

| Target Load | Actual Load | ssj_ops | |
|---|---|---|---|
| Target | Actual | ||
| Calibration 1 | 140,041 | ||
| Calibration 2 | 140,945 | ||
| Calibration 3 | 141,290 | ||
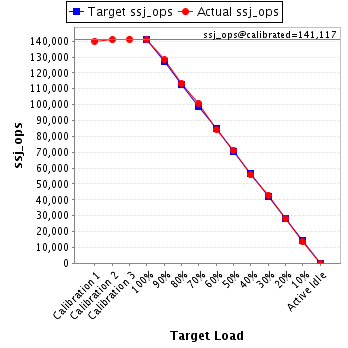
| ssj_ops@calibrated=141,117 | |||
| 100% | 99.8% | 141,117 | 140,837 |
| 90% | 90.9% | 127,006 | 128,210 |
| 80% | 80.1% | 112,894 | 113,071 |
| 70% | 71.3% | 98,782 | 100,615 |
| 60% | 59.8% | 84,670 | 84,358 |
| 50% | 50.5% | 70,559 | 71,296 |
| 40% | 39.5% | 56,447 | 55,741 |
| 30% | 30.3% | 42,335 | 42,710 |
| 20% | 19.8% | 28,223 | 27,930 |
| 10% | 9.7% | 14,112 | 13,720 |
| Active Idle | 0 | 0 | |
| Target Load | Actual Load | ssj_ops | |
|---|---|---|---|
| Target | Actual | ||
| Calibration 1 | 137,238 | ||
| Calibration 2 | 139,677 | ||
| Calibration 3 | 139,838 | ||
| ssj_ops@calibrated=139,757 | |||
| 100% | 99.2% | 139,757 | 138,633 |
| 90% | 90.6% | 125,782 | 126,552 |
| 80% | 80.8% | 111,806 | 112,954 |
| 70% | 70.3% | 97,830 | 98,232 |
| 60% | 60.1% | 83,854 | 84,014 |
| 50% | 50.6% | 69,879 | 70,727 |
| 40% | 40.1% | 55,903 | 56,025 |
| 30% | 30.0% | 41,927 | 41,922 |
| 20% | 20.1% | 27,951 | 28,035 |
| 10% | 9.8% | 13,976 | 13,695 |
| Active Idle | 0 | 0 | |

| Target Load | Actual Load | ssj_ops | |
|---|---|---|---|
| Target | Actual | ||
| Calibration 1 | 137,797 | ||
| Calibration 2 | 140,424 | ||
| Calibration 3 | 140,564 | ||
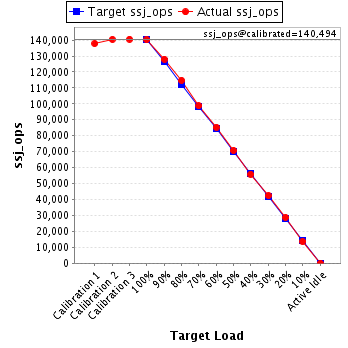
| ssj_ops@calibrated=140,494 | |||
| 100% | 99.8% | 140,494 | 140,194 |
| 90% | 91.1% | 126,444 | 128,058 |
| 80% | 81.7% | 112,395 | 114,769 |
| 70% | 70.3% | 98,346 | 98,750 |
| 60% | 60.7% | 84,296 | 85,318 |
| 50% | 50.4% | 70,247 | 70,801 |
| 40% | 39.8% | 56,197 | 55,847 |
| 30% | 30.2% | 42,148 | 42,441 |
| 20% | 20.5% | 28,099 | 28,801 |
| 10% | 9.7% | 14,049 | 13,643 |
| Active Idle | 0 | 0 | |
| Target Load | Actual Load | ssj_ops | |
|---|---|---|---|
| Target | Actual | ||
| Calibration 1 | 136,874 | ||
| Calibration 2 | 139,216 | ||
| Calibration 3 | 138,602 | ||
| ssj_ops@calibrated=138,909 | |||
| 100% | 99.3% | 138,909 | 137,886 |
| 90% | 90.1% | 125,018 | 125,179 |
| 80% | 81.9% | 111,127 | 113,761 |
| 70% | 71.1% | 97,236 | 98,747 |
| 60% | 60.5% | 83,345 | 84,044 |
| 50% | 49.8% | 69,455 | 69,134 |
| 40% | 39.6% | 55,564 | 54,985 |
| 30% | 30.2% | 41,673 | 41,922 |
| 20% | 20.1% | 27,782 | 27,937 |
| 10% | 9.9% | 13,891 | 13,731 |
| Active Idle | 0 | 0 | |

| Target Load | Actual Load | ssj_ops | |
|---|---|---|---|
| Target | Actual | ||
| Calibration 1 | 139,179 | ||
| Calibration 2 | 140,547 | ||
| Calibration 3 | 139,752 | ||
| ssj_ops@calibrated=140,150 | |||
| 100% | 99.5% | 140,150 | 139,420 |
| 90% | 90.6% | 126,135 | 126,934 |
| 80% | 81.4% | 112,120 | 114,039 |
| 70% | 70.1% | 98,105 | 98,259 |
| 60% | 59.7% | 84,090 | 83,628 |
| 50% | 49.5% | 70,075 | 69,370 |
| 40% | 39.7% | 56,060 | 55,695 |
| 30% | 30.5% | 42,045 | 42,716 |
| 20% | 20.4% | 28,030 | 28,577 |
| 10% | 9.9% | 14,015 | 13,902 |
| Active Idle | 0 | 0 | |

| Target Load | Actual Load | ssj_ops | |
|---|---|---|---|
| Target | Actual | ||
| Calibration 1 | 139,769 | ||
| Calibration 2 | 141,634 | ||
| Calibration 3 | 141,316 | ||
| ssj_ops@calibrated=141,475 | |||
| 100% | 100.0% | 141,475 | 141,405 |
| 90% | 91.5% | 127,327 | 129,391 |
| 80% | 81.6% | 113,180 | 115,395 |
| 70% | 69.9% | 99,032 | 98,915 |
| 60% | 59.6% | 84,885 | 84,375 |
| 50% | 50.0% | 70,737 | 70,712 |
| 40% | 39.9% | 56,590 | 56,447 |
| 30% | 30.3% | 42,442 | 42,837 |
| 20% | 20.0% | 28,295 | 28,305 |
| 10% | 10.4% | 14,147 | 14,651 |
| Active Idle | 0 | 0 | |

| Target Load | Actual Load | ssj_ops | |
|---|---|---|---|
| Target | Actual | ||
| Calibration 1 | 139,529 | ||
| Calibration 2 | 141,291 | ||
| Calibration 3 | 141,056 | ||
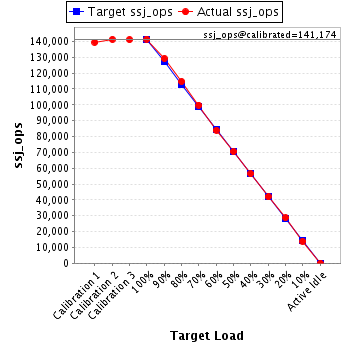
| ssj_ops@calibrated=141,174 | |||
| 100% | 100.2% | 141,174 | 141,454 |
| 90% | 91.6% | 127,056 | 129,285 |
| 80% | 81.2% | 112,939 | 114,695 |
| 70% | 70.7% | 98,822 | 99,818 |
| 60% | 59.5% | 84,704 | 83,984 |
| 50% | 50.0% | 70,587 | 70,573 |
| 40% | 40.0% | 56,469 | 56,461 |
| 30% | 29.7% | 42,352 | 41,963 |
| 20% | 20.3% | 28,235 | 28,679 |
| 10% | 9.8% | 14,117 | 13,867 |
| Active Idle | 0 | 0 | |
| Target Load | Actual Load | ssj_ops | |
|---|---|---|---|
| Target | Actual | ||
| Calibration 1 | 137,877 | ||
| Calibration 2 | 140,397 | ||
| Calibration 3 | 140,509 | ||
| ssj_ops@calibrated=140,453 | |||
| 100% | 99.7% | 140,453 | 140,015 |
| 90% | 90.7% | 126,408 | 127,353 |
| 80% | 81.5% | 112,362 | 114,428 |
| 70% | 70.0% | 98,317 | 98,276 |
| 60% | 60.4% | 84,272 | 84,900 |
| 50% | 49.7% | 70,227 | 69,828 |
| 40% | 40.4% | 56,181 | 56,791 |
| 30% | 30.4% | 42,136 | 42,694 |
| 20% | 20.2% | 28,091 | 28,376 |
| 10% | 9.9% | 14,045 | 13,910 |
| Active Idle | 0 | 0 | |

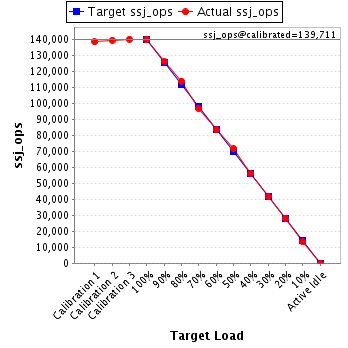
| Target Load | Actual Load | ssj_ops | |
|---|---|---|---|
| Target | Actual | ||
| Calibration 1 | 138,338 | ||
| Calibration 2 | 139,362 | ||
| Calibration 3 | 140,059 | ||
| ssj_ops@calibrated=139,711 | |||
| 100% | 100.1% | 139,711 | 139,842 |
| 90% | 90.1% | 125,740 | 125,942 |
| 80% | 81.5% | 111,768 | 113,905 |
| 70% | 69.3% | 97,797 | 96,811 |
| 60% | 59.9% | 83,826 | 83,675 |
| 50% | 51.2% | 69,855 | 71,559 |
| 40% | 40.0% | 55,884 | 55,931 |
| 30% | 29.9% | 41,913 | 41,736 |
| 20% | 20.2% | 27,942 | 28,278 |
| 10% | 9.6% | 13,971 | 13,437 |
| Active Idle | 0 | 0 | |
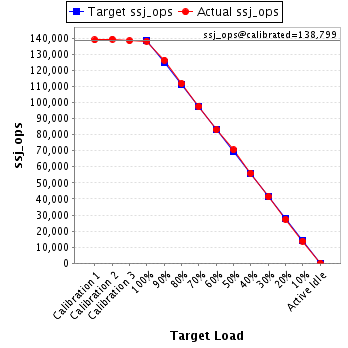
| Target Load | Actual Load | ssj_ops | |
|---|---|---|---|
| Target | Actual | ||
| Calibration 1 | 138,848 | ||
| Calibration 2 | 139,334 | ||
| Calibration 3 | 138,264 | ||
| ssj_ops@calibrated=138,799 | |||
| 100% | 99.5% | 138,799 | 138,141 |
| 90% | 91.0% | 124,919 | 126,267 |
| 80% | 80.5% | 111,039 | 111,801 |
| 70% | 70.3% | 97,159 | 97,535 |
| 60% | 59.8% | 83,279 | 83,050 |
| 50% | 50.8% | 69,399 | 70,478 |
| 40% | 40.4% | 55,520 | 56,017 |
| 30% | 29.9% | 41,640 | 41,436 |
| 20% | 19.7% | 27,760 | 27,283 |
| 10% | 9.9% | 13,880 | 13,805 |
| Active Idle | 0 | 0 | |
| Target Load | Actual Load | ssj_ops | |
|---|---|---|---|
| Target | Actual | ||
| Calibration 1 | 136,684 | ||
| Calibration 2 | 138,716 | ||
| Calibration 3 | 139,356 | ||
| ssj_ops@calibrated=139,036 | |||
| 100% | 100.1% | 139,036 | 139,194 |
| 90% | 90.1% | 125,132 | 125,228 |
| 80% | 81.2% | 111,229 | 112,955 |
| 70% | 68.9% | 97,325 | 95,806 |
| 60% | 59.4% | 83,422 | 82,555 |
| 50% | 49.7% | 69,518 | 69,046 |
| 40% | 40.2% | 55,614 | 55,872 |
| 30% | 30.4% | 41,711 | 42,244 |
| 20% | 20.5% | 27,807 | 28,473 |
| 10% | 10.1% | 13,904 | 14,034 |
| Active Idle | 0 | 0 | |

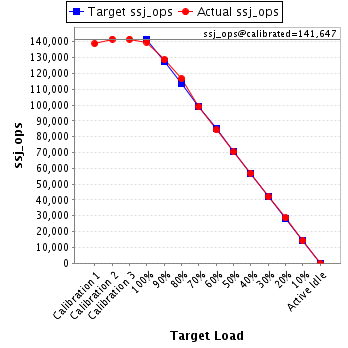
| Target Load | Actual Load | ssj_ops | |
|---|---|---|---|
| Target | Actual | ||
| Calibration 1 | 138,822 | ||
| Calibration 2 | 141,642 | ||
| Calibration 3 | 141,652 | ||
| ssj_ops@calibrated=141,647 | |||
| 100% | 98.7% | 141,647 | 139,771 |
| 90% | 90.9% | 127,482 | 128,706 |
| 80% | 82.3% | 113,318 | 116,566 |
| 70% | 69.8% | 99,153 | 98,934 |
| 60% | 59.5% | 84,988 | 84,325 |
| 50% | 49.7% | 70,824 | 70,346 |
| 40% | 40.2% | 56,659 | 56,963 |
| 30% | 29.7% | 42,494 | 42,057 |
| 20% | 20.2% | 28,329 | 28,644 |
| 10% | 10.0% | 14,165 | 14,210 |
| Active Idle | 0 | 0 | |
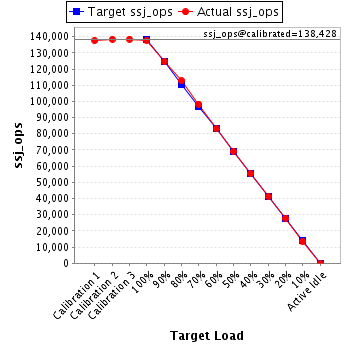
| Target Load | Actual Load | ssj_ops | |
|---|---|---|---|
| Target | Actual | ||
| Calibration 1 | 137,621 | ||
| Calibration 2 | 138,388 | ||
| Calibration 3 | 138,469 | ||
| ssj_ops@calibrated=138,428 | |||
| 100% | 99.5% | 138,428 | 137,805 |
| 90% | 90.0% | 124,585 | 124,631 |
| 80% | 81.4% | 110,743 | 112,686 |
| 70% | 71.1% | 96,900 | 98,387 |
| 60% | 60.0% | 83,057 | 83,052 |
| 50% | 49.9% | 69,214 | 69,125 |
| 40% | 40.1% | 55,371 | 55,467 |
| 30% | 29.9% | 41,528 | 41,376 |
| 20% | 20.2% | 27,686 | 27,956 |
| 10% | 9.8% | 13,843 | 13,627 |
| Active Idle | 0 | 0 | |
| Target Load | Actual Load | ssj_ops | |
|---|---|---|---|
| Target | Actual | ||
| Calibration 1 | 137,378 | ||
| Calibration 2 | 138,489 | ||
| Calibration 3 | 138,159 | ||
| ssj_ops@calibrated=138,324 | |||
| 100% | 99.7% | 138,324 | 137,976 |
| 90% | 91.1% | 124,492 | 126,018 |
| 80% | 80.9% | 110,659 | 111,919 |
| 70% | 70.0% | 96,827 | 96,846 |
| 60% | 60.5% | 82,995 | 83,642 |
| 50% | 49.3% | 69,162 | 68,167 |
| 40% | 39.6% | 55,330 | 54,829 |
| 30% | 29.7% | 41,497 | 41,147 |
| 20% | 19.8% | 27,665 | 27,345 |
| 10% | 10.1% | 13,832 | 14,001 |
| Active Idle | 0 | 0 | |

| Target Load | Actual Load | ssj_ops | |
|---|---|---|---|
| Target | Actual | ||
| Calibration 1 | 137,384 | ||
| Calibration 2 | 139,209 | ||
| Calibration 3 | 139,406 | ||
| ssj_ops@calibrated=139,307 | |||
| 100% | 100.1% | 139,307 | 139,476 |
| 90% | 90.9% | 125,377 | 126,566 |
| 80% | 81.1% | 111,446 | 113,032 |
| 70% | 70.7% | 97,515 | 98,482 |
| 60% | 60.5% | 83,584 | 84,272 |
| 50% | 49.5% | 69,654 | 68,986 |
| 40% | 40.3% | 55,723 | 56,177 |
| 30% | 29.8% | 41,792 | 41,474 |
| 20% | 19.8% | 27,861 | 27,618 |
| 10% | 10.1% | 13,931 | 14,089 |
| Active Idle | 0 | 0 | |
