SPECpower_ssj2008
Host 'M915-06' Performance Report
Copyright © 2007-2011 Standard Performance Evaluation Corporation
| Dell Inc. PowerEdge M915 | ssj_ops@100% = 2,240,694 ssj_ops@100% per JVM = 140,043 |
||||
| Test Sponsor: | Dell Inc. | SPEC License #: | 55 | Test Method: | Multi Node |
| Tested By: | Dell Inc. | Test Location: | Round Rock, TX, USA | Test Date: | Oct 29, 2011 |
| Hardware Availability: | Nov-2011 | Software Availability: | Feb-2011 | Publication: | Nov 16, 2011 |
| System Source: | Single Supplier | System Designation: | Server | Power Provisioning: | Line-powered |
| Target Load | Actual Load | ssj_ops | |
|---|---|---|---|
| Target | Actual | ||
| Calibration 1 | 2,209,175 | ||
| Calibration 2 | 2,243,697 | ||
| Calibration 3 | 2,241,252 | ||
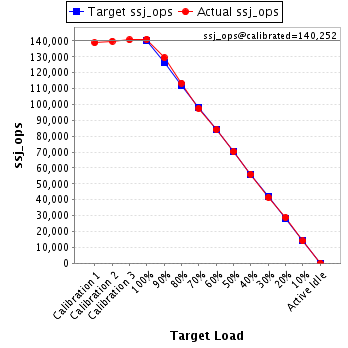
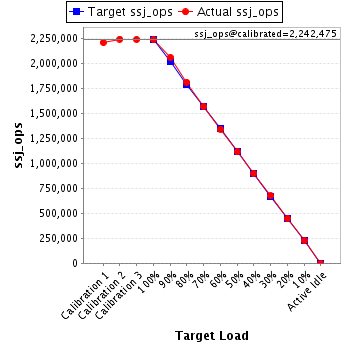
| ssj_ops@calibrated=2,242,475 | |||
| 100% | 99.9% | 2,242,475 | 2,240,694 |
| 90% | 91.9% | 2,018,227 | 2,061,813 |
| 80% | 80.8% | 1,793,980 | 1,812,622 |
| 70% | 69.9% | 1,569,732 | 1,567,617 |
| 60% | 59.9% | 1,345,485 | 1,343,666 |
| 50% | 49.8% | 1,121,237 | 1,117,076 |
| 40% | 40.1% | 896,990 | 900,070 |
| 30% | 30.0% | 672,742 | 673,600 |
| 20% | 19.9% | 448,495 | 446,257 |
| 10% | 10.1% | 224,247 | 226,169 |
| Active Idle | 0 | 0 | |
| Set Identifier: | sut |
| Set Description: | M915 |
| # of Identical Nodes: | 8 |
| Comment: | None |
| Hardware | |
|---|---|
| Hardware Vendor: | Dell Inc. |
| Model: | PowerEdge M915 |
| Form Factor: | Blade |
| CPU Name: | AMD Opteron 6276 (2.30 GHz) |
| CPU Characteristics: | 16 Core, 2.30 GHz, 16 MB L3 Cache |
| CPU Frequency (MHz): | 2300 |
| CPU(s) Enabled: | 64 cores, 4 chips, 16 cores/chip |
| Hardware Threads: | 64 (1 / core) |
| CPU(s) Orderable: | 2,4 chips |
| Primary Cache: | 512 KB I + 256 KB D on chip per chip |
| Secondary Cache: | 16 MB I+D on chip per chip, 2 MB shared / 2 cores |
| Tertiary Cache: | 16 MB I+D on chip per chip, 8MB shared / 8 cores |
| Other Cache: | None |
| Memory Amount (GB): | 64 |
| # and size of DIMM: | 16 x 4096 MB |
| Memory Details: | 4GB 2Rx8 PC3L-10600R ECC RDIMM, Slots A1-A4, B1-B4, C1-C4, D1-D4 populated |
| Power Supply Quantity and Rating (W): | None |
| Power Supply Details: | Shared |
| Disk Drive: | 1 x 50 GB 2.5" SSD SATA (Dell PN X2N7H) |
| Disk Controller: | PERC H200 Modular |
| # and type of Network Interface Cards (NICs) Installed: | 2 x onboard dual-port 1 Gigabit Ethernet |
| NICs Enabled in Firmware / OS / Connected: | 2/2/1 |
| Network Speed (Mbit): | 1000 |
| Keyboard: | None |
| Mouse: | None |
| Monitor: | None |
| Optical Drives: | No |
| Other Hardware: | None |
| Software | |
|---|---|
| Power Management: | Balanced Mode in OS (See Notes) |
| Operating System (OS): | Windows 2008 Server Enterprise x64 Edition |
| OS Version: | R2 SP1 |
| Filesystem: | NTFS |
| JVM Vendor: | IBM Corporation |
| JVM Version: | IBM J9 VM (build 2.4, J2RE 1.6.0 IBM J9 2.4 Windows Server 2008 amd64-64 jvmwa64 60sr5-20090519_35743 (JIT enabled, AOT enabled) |
| JVM Command-line Options: | -Xaggressive -Xcompressedrefs -Xgcpolicy:gencon -Xmn1400m -Xms1875m -Xmx1875m -XlockReservation -Xnoloa -Xlp |
| JVM Affinity: | start /affinity [F, F0, F00, F000, F0000, F00000, F000000, F0000000, F00000000, F000000000, F0000000000, F00000000000, F000000000000, F0000000000000, F00000000000000, F000000000000000] |
| JVM Instances: | 16 |
| JVM Initial Heap (MB): | 1875 |
| JVM Maximum Heap (MB): | 1875 |
| JVM Address Bits: | 64 |
| Boot Firmware Version: | 2.3.0 |
| Management Firmware Version: | iDRAC 3.30 build 17 |
| Workload Version: | SSJ 1.2.9 |
| Director Location: | Controller |
| Other Software: | IBM WebSphere Application Server V7.0 for Windows on x86-64bit |
| JVM Instance | ssj_ops@100% |
|---|---|
| M915-06.001 | 140,906 |
| M915-06.002 | 141,545 |
| M915-06.003 | 138,054 |
| M915-06.004 | 140,497 |
| M915-06.005 | 139,795 |
| M915-06.006 | 139,135 |
| M915-06.007 | 140,573 |
| M915-06.008 | 140,744 |
| M915-06.009 | 138,853 |
| M915-06.010 | 140,553 |
| M915-06.011 | 140,945 |
| M915-06.012 | 139,415 |
| M915-06.013 | 139,343 |
| M915-06.014 | 138,947 |
| M915-06.015 | 140,275 |
| M915-06.016 | 141,113 |
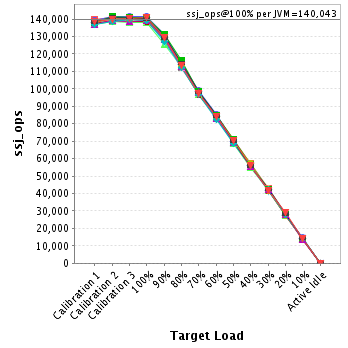
| ssj_ops@100% | 2,240,694 |
| ssj_ops@100% per JVM | 140,043 |
| Target Load | Actual Load | ssj_ops | |
|---|---|---|---|
| Target | Actual | ||
| Calibration 1 | 139,614 | ||
| Calibration 2 | 141,199 | ||
| Calibration 3 | 140,757 | ||
| ssj_ops@calibrated=140,978 | |||
| 100% | 99.9% | 140,978 | 140,906 |
| 90% | 92.5% | 126,880 | 130,348 |
| 80% | 81.1% | 112,782 | 114,322 |
| 70% | 69.7% | 98,685 | 98,222 |
| 60% | 60.2% | 84,587 | 84,842 |
| 50% | 50.3% | 70,489 | 70,905 |
| 40% | 40.4% | 56,391 | 56,992 |
| 30% | 30.4% | 42,293 | 42,884 |
| 20% | 19.9% | 28,196 | 28,113 |
| 10% | 10.2% | 14,098 | 14,353 |
| Active Idle | 0 | 0 | |

| Target Load | Actual Load | ssj_ops | |
|---|---|---|---|
| Target | Actual | ||
| Calibration 1 | 139,473 | ||
| Calibration 2 | 141,309 | ||
| Calibration 3 | 141,484 | ||
| ssj_ops@calibrated=141,396 | |||
| 100% | 100.1% | 141,396 | 141,545 |
| 90% | 92.9% | 127,257 | 131,323 |
| 80% | 81.1% | 113,117 | 114,607 |
| 70% | 70.0% | 98,977 | 98,914 |
| 60% | 60.4% | 84,838 | 85,449 |
| 50% | 49.4% | 70,698 | 69,827 |
| 40% | 39.9% | 56,558 | 56,457 |
| 30% | 29.8% | 42,419 | 42,186 |
| 20% | 19.8% | 28,279 | 28,009 |
| 10% | 10.3% | 14,140 | 14,577 |
| Active Idle | 0 | 0 | |
| Target Load | Actual Load | ssj_ops | |
|---|---|---|---|
| Target | Actual | ||
| Calibration 1 | 136,634 | ||
| Calibration 2 | 138,395 | ||
| Calibration 3 | 138,061 | ||
| ssj_ops@calibrated=138,228 | |||
| 100% | 99.9% | 138,228 | 138,054 |
| 90% | 90.9% | 124,405 | 125,647 |
| 80% | 81.5% | 110,582 | 112,594 |
| 70% | 70.0% | 96,759 | 96,822 |
| 60% | 60.6% | 82,937 | 83,787 |
| 50% | 49.5% | 69,114 | 68,437 |
| 40% | 39.8% | 55,291 | 54,951 |
| 30% | 30.3% | 41,468 | 41,840 |
| 20% | 19.8% | 27,646 | 27,410 |
| 10% | 10.3% | 13,823 | 14,221 |
| Active Idle | 0 | 0 | |

| Target Load | Actual Load | ssj_ops | |
|---|---|---|---|
| Target | Actual | ||
| Calibration 1 | 137,694 | ||
| Calibration 2 | 140,476 | ||
| Calibration 3 | 140,431 | ||
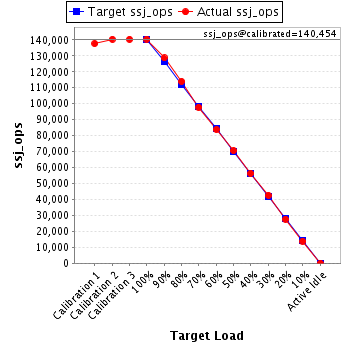
| ssj_ops@calibrated=140,454 | |||
| 100% | 100.0% | 140,454 | 140,497 |
| 90% | 91.6% | 126,409 | 128,723 |
| 80% | 81.2% | 112,363 | 114,069 |
| 70% | 69.6% | 98,318 | 97,791 |
| 60% | 59.7% | 84,272 | 83,876 |
| 50% | 50.3% | 70,227 | 70,603 |
| 40% | 40.1% | 56,182 | 56,377 |
| 30% | 30.3% | 42,136 | 42,606 |
| 20% | 19.7% | 28,091 | 27,654 |
| 10% | 9.9% | 14,045 | 13,844 |
| Active Idle | 0 | 0 | |
| Target Load | Actual Load | ssj_ops | |
|---|---|---|---|
| Target | Actual | ||
| Calibration 1 | 137,737 | ||
| Calibration 2 | 140,404 | ||
| Calibration 3 | 140,269 | ||
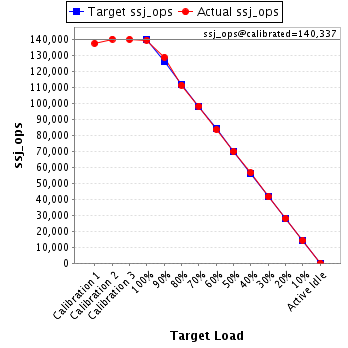
| ssj_ops@calibrated=140,337 | |||
| 100% | 99.6% | 140,337 | 139,795 |
| 90% | 92.0% | 126,303 | 129,046 |
| 80% | 79.5% | 112,269 | 111,513 |
| 70% | 70.2% | 98,236 | 98,479 |
| 60% | 59.7% | 84,202 | 83,825 |
| 50% | 49.9% | 70,168 | 70,030 |
| 40% | 40.4% | 56,135 | 56,638 |
| 30% | 29.7% | 42,101 | 41,639 |
| 20% | 20.0% | 28,067 | 28,092 |
| 10% | 10.2% | 14,034 | 14,331 |
| Active Idle | 0 | 0 | |
| Target Load | Actual Load | ssj_ops | |
|---|---|---|---|
| Target | Actual | ||
| Calibration 1 | 137,601 | ||
| Calibration 2 | 139,555 | ||
| Calibration 3 | 138,547 | ||
| ssj_ops@calibrated=139,051 | |||
| 100% | 100.1% | 139,051 | 139,135 |
| 90% | 91.1% | 125,146 | 126,643 |
| 80% | 80.7% | 111,241 | 112,239 |
| 70% | 70.9% | 97,336 | 98,543 |
| 60% | 59.8% | 83,431 | 83,151 |
| 50% | 49.9% | 69,526 | 69,394 |
| 40% | 40.5% | 55,620 | 56,280 |
| 30% | 29.8% | 41,715 | 41,404 |
| 20% | 19.9% | 27,810 | 27,685 |
| 10% | 10.1% | 13,905 | 14,038 |
| Active Idle | 0 | 0 | |

| Target Load | Actual Load | ssj_ops | |
|---|---|---|---|
| Target | Actual | ||
| Calibration 1 | 139,362 | ||
| Calibration 2 | 140,017 | ||
| Calibration 3 | 140,813 | ||
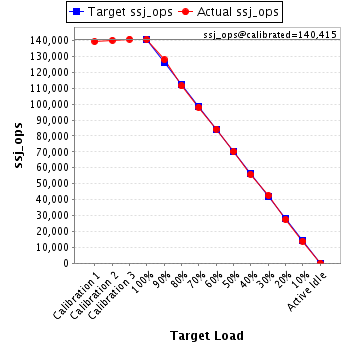
| ssj_ops@calibrated=140,415 | |||
| 100% | 100.1% | 140,415 | 140,573 |
| 90% | 91.1% | 126,373 | 127,914 |
| 80% | 79.3% | 112,332 | 111,394 |
| 70% | 69.8% | 98,290 | 98,007 |
| 60% | 60.1% | 84,249 | 84,326 |
| 50% | 50.0% | 70,207 | 70,190 |
| 40% | 39.7% | 56,166 | 55,754 |
| 30% | 30.3% | 42,124 | 42,563 |
| 20% | 19.6% | 28,083 | 27,475 |
| 10% | 9.9% | 14,041 | 13,891 |
| Active Idle | 0 | 0 | |
| Target Load | Actual Load | ssj_ops | |
|---|---|---|---|
| Target | Actual | ||
| Calibration 1 | 138,171 | ||
| Calibration 2 | 141,132 | ||
| Calibration 3 | 140,785 | ||
| ssj_ops@calibrated=140,959 | |||
| 100% | 99.8% | 140,959 | 140,744 |
| 90% | 91.8% | 126,863 | 129,340 |
| 80% | 79.5% | 112,767 | 112,073 |
| 70% | 69.9% | 98,671 | 98,504 |
| 60% | 59.6% | 84,575 | 84,007 |
| 50% | 49.4% | 70,479 | 69,580 |
| 40% | 40.6% | 56,384 | 57,181 |
| 30% | 29.9% | 42,288 | 42,150 |
| 20% | 20.0% | 28,192 | 28,188 |
| 10% | 10.3% | 14,096 | 14,451 |
| Active Idle | 0 | 0 | |

| Target Load | Actual Load | ssj_ops | |
|---|---|---|---|
| Target | Actual | ||
| Calibration 1 | 137,265 | ||
| Calibration 2 | 139,310 | ||
| Calibration 3 | 138,891 | ||
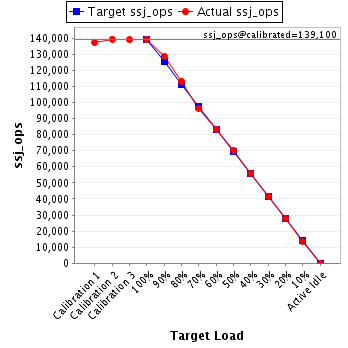
| ssj_ops@calibrated=139,100 | |||
| 100% | 99.8% | 139,100 | 138,853 |
| 90% | 92.5% | 125,190 | 128,640 |
| 80% | 81.2% | 111,280 | 112,970 |
| 70% | 69.4% | 97,370 | 96,504 |
| 60% | 60.0% | 83,460 | 83,440 |
| 50% | 50.5% | 69,550 | 70,212 |
| 40% | 40.2% | 55,640 | 55,976 |
| 30% | 30.0% | 41,730 | 41,784 |
| 20% | 20.0% | 27,820 | 27,861 |
| 10% | 9.9% | 13,910 | 13,800 |
| Active Idle | 0 | 0 | |
| Target Load | Actual Load | ssj_ops | |
|---|---|---|---|
| Target | Actual | ||
| Calibration 1 | 138,081 | ||
| Calibration 2 | 140,922 | ||
| Calibration 3 | 140,955 | ||
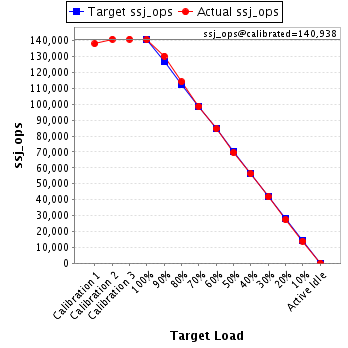
| ssj_ops@calibrated=140,938 | |||
| 100% | 99.7% | 140,938 | 140,553 |
| 90% | 92.5% | 126,844 | 130,367 |
| 80% | 80.9% | 112,751 | 114,056 |
| 70% | 70.0% | 98,657 | 98,696 |
| 60% | 60.1% | 84,563 | 84,645 |
| 50% | 49.4% | 70,469 | 69,574 |
| 40% | 39.9% | 56,375 | 56,187 |
| 30% | 29.6% | 42,281 | 41,768 |
| 20% | 19.4% | 28,188 | 27,357 |
| 10% | 9.9% | 14,094 | 13,949 |
| Active Idle | 0 | 0 | |
| Target Load | Actual Load | ssj_ops | |
|---|---|---|---|
| Target | Actual | ||
| Calibration 1 | 138,212 | ||
| Calibration 2 | 141,580 | ||
| Calibration 3 | 141,074 | ||
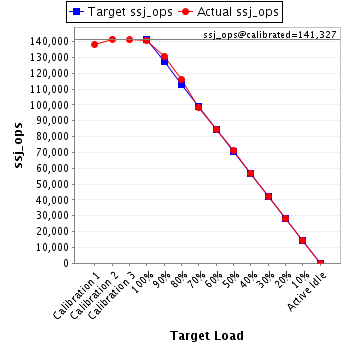
| ssj_ops@calibrated=141,327 | |||
| 100% | 99.7% | 141,327 | 140,945 |
| 90% | 92.6% | 127,194 | 130,895 |
| 80% | 82.1% | 113,062 | 115,987 |
| 70% | 69.7% | 98,929 | 98,521 |
| 60% | 59.9% | 84,796 | 84,723 |
| 50% | 50.4% | 70,663 | 71,240 |
| 40% | 40.3% | 56,531 | 56,909 |
| 30% | 29.9% | 42,398 | 42,195 |
| 20% | 20.0% | 28,265 | 28,217 |
| 10% | 10.2% | 14,133 | 14,484 |
| Active Idle | 0 | 0 | |
| Target Load | Actual Load | ssj_ops | |
|---|---|---|---|
| Target | Actual | ||
| Calibration 1 | 137,955 | ||
| Calibration 2 | 140,302 | ||
| Calibration 3 | 139,814 | ||
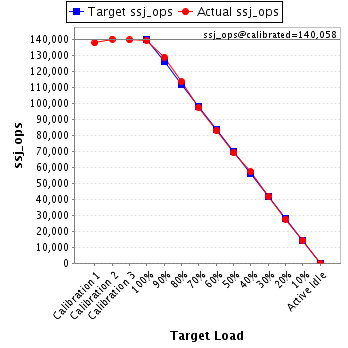
| ssj_ops@calibrated=140,058 | |||
| 100% | 99.5% | 140,058 | 139,415 |
| 90% | 92.1% | 126,052 | 128,950 |
| 80% | 81.1% | 112,046 | 113,526 |
| 70% | 69.7% | 98,041 | 97,561 |
| 60% | 59.3% | 84,035 | 83,079 |
| 50% | 49.4% | 70,029 | 69,154 |
| 40% | 40.9% | 56,023 | 57,290 |
| 30% | 29.9% | 42,017 | 41,872 |
| 20% | 19.7% | 28,012 | 27,630 |
| 10% | 10.1% | 14,006 | 14,165 |
| Active Idle | 0 | 0 | |
| Target Load | Actual Load | ssj_ops | |
|---|---|---|---|
| Target | Actual | ||
| Calibration 1 | 136,996 | ||
| Calibration 2 | 139,347 | ||
| Calibration 3 | 138,794 | ||
| ssj_ops@calibrated=139,070 | |||
| 100% | 100.2% | 139,070 | 139,343 |
| 90% | 92.4% | 125,163 | 128,479 |
| 80% | 81.0% | 111,256 | 112,677 |
| 70% | 70.6% | 97,349 | 98,146 |
| 60% | 59.8% | 83,442 | 83,125 |
| 50% | 49.7% | 69,535 | 69,145 |
| 40% | 40.0% | 55,628 | 55,685 |
| 30% | 30.2% | 41,721 | 42,056 |
| 20% | 19.9% | 27,814 | 27,683 |
| 10% | 9.9% | 13,907 | 13,806 |
| Active Idle | 0 | 0 | |

| Target Load | Actual Load | ssj_ops | |
|---|---|---|---|
| Target | Actual | ||
| Calibration 1 | 136,975 | ||
| Calibration 2 | 138,726 | ||
| Calibration 3 | 139,508 | ||
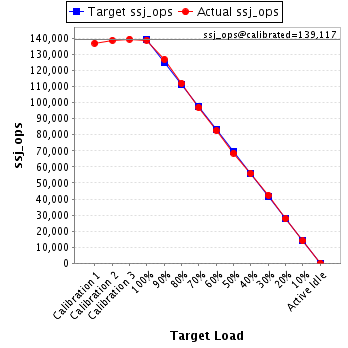
| ssj_ops@calibrated=139,117 | |||
| 100% | 99.9% | 139,117 | 138,947 |
| 90% | 91.2% | 125,205 | 126,891 |
| 80% | 80.5% | 111,294 | 112,050 |
| 70% | 69.7% | 97,382 | 96,995 |
| 60% | 59.4% | 83,470 | 82,584 |
| 50% | 49.3% | 69,559 | 68,528 |
| 40% | 40.1% | 55,647 | 55,816 |
| 30% | 30.4% | 41,735 | 42,336 |
| 20% | 19.9% | 27,823 | 27,738 |
| 10% | 10.0% | 13,912 | 13,949 |
| Active Idle | 0 | 0 | |
| Target Load | Actual Load | ssj_ops | |
|---|---|---|---|
| Target | Actual | ||
| Calibration 1 | 138,605 | ||
| Calibration 2 | 141,124 | ||
| Calibration 3 | 140,465 | ||
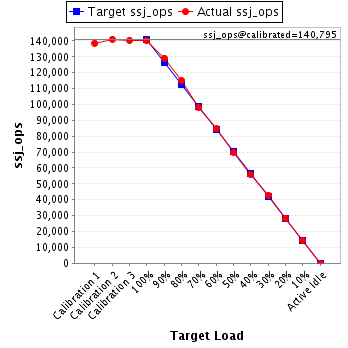
| ssj_ops@calibrated=140,795 | |||
| 100% | 99.6% | 140,795 | 140,275 |
| 90% | 91.8% | 126,715 | 129,213 |
| 80% | 81.7% | 112,636 | 115,037 |
| 70% | 69.9% | 98,556 | 98,405 |
| 60% | 60.1% | 84,477 | 84,629 |
| 50% | 49.7% | 70,397 | 69,991 |
| 40% | 39.5% | 56,318 | 55,643 |
| 30% | 30.4% | 42,238 | 42,827 |
| 20% | 20.1% | 28,159 | 28,314 |
| 10% | 10.1% | 14,079 | 14,270 |
| Active Idle | 0 | 0 | |
| Target Load | Actual Load | ssj_ops | |
|---|---|---|---|
| Target | Actual | ||
| Calibration 1 | 138,799 | ||
| Calibration 2 | 139,900 | ||
| Calibration 3 | 140,603 | ||
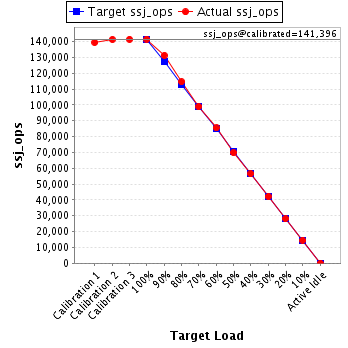
| ssj_ops@calibrated=140,252 | |||
| 100% | 100.6% | 140,252 | 141,113 |
| 90% | 92.3% | 126,227 | 129,395 |
| 80% | 80.9% | 112,201 | 113,507 |
| 70% | 69.5% | 98,176 | 97,505 |
| 60% | 60.0% | 84,151 | 84,177 |
| 50% | 50.1% | 70,126 | 70,267 |
| 40% | 39.9% | 56,101 | 55,934 |
| 30% | 29.6% | 42,076 | 41,489 |
| 20% | 20.6% | 28,050 | 28,832 |
| 10% | 10.0% | 14,025 | 14,041 |
| Active Idle | 0 | 0 | |