SPECpower_ssj2008
Host 'M915-07' Performance Report
Copyright © 2007-2011 Standard Performance Evaluation Corporation
| Dell Inc. PowerEdge M915 | ssj_ops@100% = 2,235,854 ssj_ops@100% per JVM = 139,741 |
||||
| Test Sponsor: | Dell Inc. | SPEC License #: | 55 | Test Method: | Multi Node |
| Tested By: | Dell Inc. | Test Location: | Round Rock, TX, USA | Test Date: | Oct 29, 2011 |
| Hardware Availability: | Nov-2011 | Software Availability: | Feb-2011 | Publication: | Nov 16, 2011 |
| System Source: | Single Supplier | System Designation: | Server | Power Provisioning: | Line-powered |
| Target Load | Actual Load | ssj_ops | |
|---|---|---|---|
| Target | Actual | ||
| Calibration 1 | 2,215,855 | ||
| Calibration 2 | 2,239,844 | ||
| Calibration 3 | 2,236,479 | ||
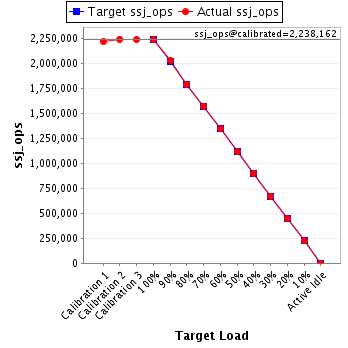
| ssj_ops@calibrated=2,238,162 | |||
| 100% | 99.9% | 2,238,162 | 2,235,854 |
| 90% | 90.6% | 2,014,345 | 2,028,006 |
| 80% | 79.9% | 1,790,529 | 1,788,878 |
| 70% | 70.2% | 1,566,713 | 1,570,838 |
| 60% | 60.0% | 1,342,897 | 1,342,229 |
| 50% | 50.0% | 1,119,081 | 1,118,503 |
| 40% | 40.1% | 895,265 | 897,104 |
| 30% | 30.0% | 671,448 | 671,309 |
| 20% | 19.9% | 447,632 | 445,356 |
| 10% | 10.0% | 223,816 | 224,324 |
| Active Idle | 0 | 0 | |
| Set Identifier: | sut |
| Set Description: | M915 |
| # of Identical Nodes: | 8 |
| Comment: | None |
| Hardware | |
|---|---|
| Hardware Vendor: | Dell Inc. |
| Model: | PowerEdge M915 |
| Form Factor: | Blade |
| CPU Name: | AMD Opteron 6276 (2.30 GHz) |
| CPU Characteristics: | 16 Core, 2.30 GHz, 16 MB L3 Cache |
| CPU Frequency (MHz): | 2300 |
| CPU(s) Enabled: | 64 cores, 4 chips, 16 cores/chip |
| Hardware Threads: | 64 (1 / core) |
| CPU(s) Orderable: | 2,4 chips |
| Primary Cache: | 512 KB I + 256 KB D on chip per chip |
| Secondary Cache: | 16 MB I+D on chip per chip, 2 MB shared / 2 cores |
| Tertiary Cache: | 16 MB I+D on chip per chip, 8MB shared / 8 cores |
| Other Cache: | None |
| Memory Amount (GB): | 64 |
| # and size of DIMM: | 16 x 4096 MB |
| Memory Details: | 4GB 2Rx8 PC3L-10600R ECC RDIMM, Slots A1-A4, B1-B4, C1-C4, D1-D4 populated |
| Power Supply Quantity and Rating (W): | None |
| Power Supply Details: | Shared |
| Disk Drive: | 1 x 50 GB 2.5" SSD SATA (Dell PN X2N7H) |
| Disk Controller: | PERC H200 Modular |
| # and type of Network Interface Cards (NICs) Installed: | 2 x onboard dual-port 1 Gigabit Ethernet |
| NICs Enabled in Firmware / OS / Connected: | 2/2/1 |
| Network Speed (Mbit): | 1000 |
| Keyboard: | None |
| Mouse: | None |
| Monitor: | None |
| Optical Drives: | No |
| Other Hardware: | None |
| Software | |
|---|---|
| Power Management: | Balanced Mode in OS (See Notes) |
| Operating System (OS): | Windows 2008 Server Enterprise x64 Edition |
| OS Version: | R2 SP1 |
| Filesystem: | NTFS |
| JVM Vendor: | IBM Corporation |
| JVM Version: | IBM J9 VM (build 2.4, J2RE 1.6.0 IBM J9 2.4 Windows Server 2008 amd64-64 jvmwa64 60sr5-20090519_35743 (JIT enabled, AOT enabled) |
| JVM Command-line Options: | -Xaggressive -Xcompressedrefs -Xgcpolicy:gencon -Xmn1400m -Xms1875m -Xmx1875m -XlockReservation -Xnoloa -Xlp |
| JVM Affinity: | start /affinity [F, F0, F00, F000, F0000, F00000, F000000, F0000000, F00000000, F000000000, F0000000000, F00000000000, F000000000000, F0000000000000, F00000000000000, F000000000000000] |
| JVM Instances: | 16 |
| JVM Initial Heap (MB): | 1875 |
| JVM Maximum Heap (MB): | 1875 |
| JVM Address Bits: | 64 |
| Boot Firmware Version: | 2.3.0 |
| Management Firmware Version: | iDRAC 3.30 build 17 |
| Workload Version: | SSJ 1.2.9 |
| Director Location: | Controller |
| Other Software: | IBM WebSphere Application Server V7.0 for Windows on x86-64bit |
| JVM Instance | ssj_ops@100% |
|---|---|
| M915-07.001 | 140,878 |
| M915-07.002 | 140,080 |
| M915-07.003 | 140,433 |
| M915-07.004 | 138,079 |
| M915-07.005 | 140,197 |
| M915-07.006 | 139,413 |
| M915-07.007 | 138,837 |
| M915-07.008 | 140,053 |
| M915-07.009 | 141,899 |
| M915-07.010 | 141,602 |
| M915-07.011 | 139,106 |
| M915-07.012 | 139,330 |
| M915-07.013 | 139,200 |
| M915-07.014 | 138,933 |
| M915-07.015 | 138,654 |
| M915-07.016 | 139,160 |
| ssj_ops@100% | 2,235,854 |
| ssj_ops@100% per JVM | 139,741 |
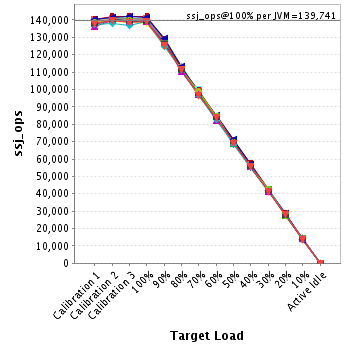
| Target Load | Actual Load | ssj_ops | |
|---|---|---|---|
| Target | Actual | ||
| Calibration 1 | 140,435 | ||
| Calibration 2 | 140,642 | ||
| Calibration 3 | 140,928 | ||
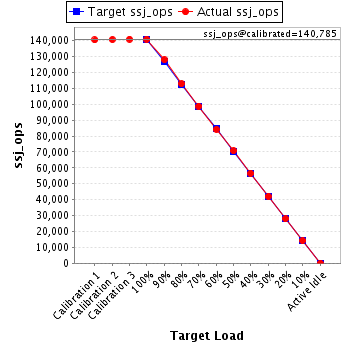
| ssj_ops@calibrated=140,785 | |||
| 100% | 100.1% | 140,785 | 140,878 |
| 90% | 90.9% | 126,707 | 127,987 |
| 80% | 80.1% | 112,628 | 112,833 |
| 70% | 70.2% | 98,550 | 98,775 |
| 60% | 59.8% | 84,471 | 84,202 |
| 50% | 50.2% | 70,393 | 70,711 |
| 40% | 40.2% | 56,314 | 56,598 |
| 30% | 29.9% | 42,236 | 42,066 |
| 20% | 19.8% | 28,157 | 27,898 |
| 10% | 10.1% | 14,079 | 14,240 |
| Active Idle | 0 | 0 | |
| Target Load | Actual Load | ssj_ops | |
|---|---|---|---|
| Target | Actual | ||
| Calibration 1 | 139,836 | ||
| Calibration 2 | 139,618 | ||
| Calibration 3 | 139,974 | ||
| ssj_ops@calibrated=139,796 | |||
| 100% | 100.2% | 139,796 | 140,080 |
| 90% | 91.3% | 125,817 | 127,689 |
| 80% | 80.2% | 111,837 | 112,096 |
| 70% | 70.2% | 97,857 | 98,085 |
| 60% | 59.8% | 83,878 | 83,604 |
| 50% | 50.7% | 69,898 | 70,869 |
| 40% | 40.0% | 55,919 | 55,868 |
| 30% | 30.0% | 41,939 | 41,974 |
| 20% | 19.7% | 27,959 | 27,589 |
| 10% | 9.9% | 13,980 | 13,873 |
| Active Idle | 0 | 0 | |

| Target Load | Actual Load | ssj_ops | |
|---|---|---|---|
| Target | Actual | ||
| Calibration 1 | 140,242 | ||
| Calibration 2 | 141,314 | ||
| Calibration 3 | 140,751 | ||
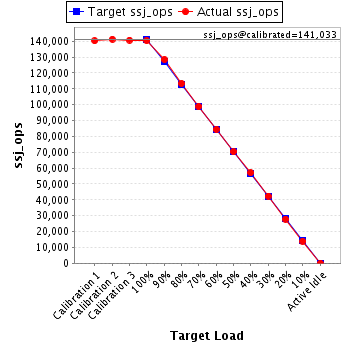
| ssj_ops@calibrated=141,033 | |||
| 100% | 99.6% | 141,033 | 140,433 |
| 90% | 91.1% | 126,929 | 128,465 |
| 80% | 80.4% | 112,826 | 113,460 |
| 70% | 70.1% | 98,723 | 98,840 |
| 60% | 59.9% | 84,620 | 84,500 |
| 50% | 49.8% | 70,516 | 70,281 |
| 40% | 40.4% | 56,413 | 57,047 |
| 30% | 30.1% | 42,310 | 42,396 |
| 20% | 19.8% | 28,207 | 27,876 |
| 10% | 9.9% | 14,103 | 13,988 |
| Active Idle | 0 | 0 | |
| Target Load | Actual Load | ssj_ops | |
|---|---|---|---|
| Target | Actual | ||
| Calibration 1 | 136,076 | ||
| Calibration 2 | 138,860 | ||
| Calibration 3 | 138,540 | ||
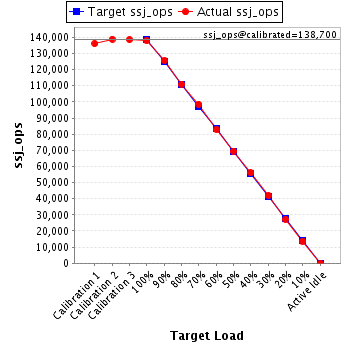
| ssj_ops@calibrated=138,700 | |||
| 100% | 99.6% | 138,700 | 138,079 |
| 90% | 90.5% | 124,830 | 125,567 |
| 80% | 80.0% | 110,960 | 111,018 |
| 70% | 71.1% | 97,090 | 98,566 |
| 60% | 59.8% | 83,220 | 83,004 |
| 50% | 50.1% | 69,350 | 69,493 |
| 40% | 40.4% | 55,480 | 55,988 |
| 30% | 30.2% | 41,610 | 41,885 |
| 20% | 19.7% | 27,740 | 27,265 |
| 10% | 9.9% | 13,870 | 13,764 |
| Active Idle | 0 | 0 | |
| Target Load | Actual Load | ssj_ops | |
|---|---|---|---|
| Target | Actual | ||
| Calibration 1 | 138,579 | ||
| Calibration 2 | 140,161 | ||
| Calibration 3 | 139,802 | ||
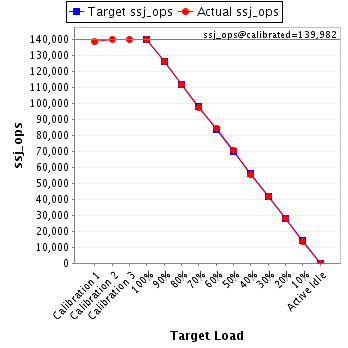
| ssj_ops@calibrated=139,982 | |||
| 100% | 100.2% | 139,982 | 140,197 |
| 90% | 90.2% | 125,983 | 126,269 |
| 80% | 79.8% | 111,985 | 111,683 |
| 70% | 69.7% | 97,987 | 97,604 |
| 60% | 60.2% | 83,989 | 84,232 |
| 50% | 50.5% | 69,991 | 70,698 |
| 40% | 39.6% | 55,993 | 55,475 |
| 30% | 29.7% | 41,994 | 41,633 |
| 20% | 20.1% | 27,996 | 28,111 |
| 10% | 9.9% | 13,998 | 13,917 |
| Active Idle | 0 | 0 | |
| Target Load | Actual Load | ssj_ops | |
|---|---|---|---|
| Target | Actual | ||
| Calibration 1 | 137,216 | ||
| Calibration 2 | 139,714 | ||
| Calibration 3 | 139,498 | ||
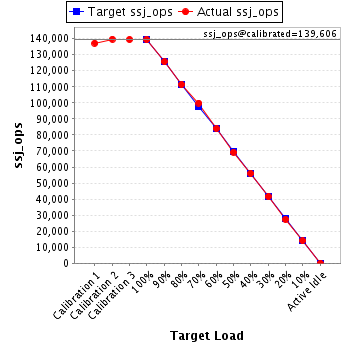
| ssj_ops@calibrated=139,606 | |||
| 100% | 99.9% | 139,606 | 139,413 |
| 90% | 90.0% | 125,645 | 125,612 |
| 80% | 79.8% | 111,685 | 111,438 |
| 70% | 71.5% | 97,724 | 99,886 |
| 60% | 60.2% | 83,764 | 84,038 |
| 50% | 49.6% | 69,803 | 69,282 |
| 40% | 40.1% | 55,842 | 56,018 |
| 30% | 29.8% | 41,882 | 41,623 |
| 20% | 19.6% | 27,921 | 27,390 |
| 10% | 10.0% | 13,961 | 14,025 |
| Active Idle | 0 | 0 | |
| Target Load | Actual Load | ssj_ops | |
|---|---|---|---|
| Target | Actual | ||
| Calibration 1 | 137,177 | ||
| Calibration 2 | 139,446 | ||
| Calibration 3 | 138,975 | ||
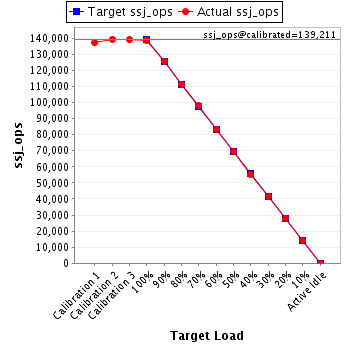
| ssj_ops@calibrated=139,211 | |||
| 100% | 99.7% | 139,211 | 138,837 |
| 90% | 90.1% | 125,290 | 125,452 |
| 80% | 80.1% | 111,369 | 111,506 |
| 70% | 70.5% | 97,448 | 98,164 |
| 60% | 60.0% | 83,527 | 83,513 |
| 50% | 49.7% | 69,605 | 69,237 |
| 40% | 39.8% | 55,684 | 55,345 |
| 30% | 30.0% | 41,763 | 41,742 |
| 20% | 20.1% | 27,842 | 27,957 |
| 10% | 10.2% | 13,921 | 14,253 |
| Active Idle | 0 | 0 | |
| Target Load | Actual Load | ssj_ops | |
|---|---|---|---|
| Target | Actual | ||
| Calibration 1 | 139,328 | ||
| Calibration 2 | 140,239 | ||
| Calibration 3 | 140,946 | ||
| ssj_ops@calibrated=140,592 | |||
| 100% | 99.6% | 140,592 | 140,053 |
| 90% | 91.1% | 126,533 | 128,109 |
| 80% | 79.7% | 112,474 | 112,084 |
| 70% | 70.4% | 98,415 | 98,997 |
| 60% | 60.2% | 84,355 | 84,617 |
| 50% | 50.2% | 70,296 | 70,513 |
| 40% | 40.4% | 56,237 | 56,756 |
| 30% | 30.2% | 42,178 | 42,393 |
| 20% | 19.7% | 28,118 | 27,645 |
| 10% | 10.1% | 14,059 | 14,227 |
| Active Idle | 0 | 0 | |

| Target Load | Actual Load | ssj_ops | |
|---|---|---|---|
| Target | Actual | ||
| Calibration 1 | 140,326 | ||
| Calibration 2 | 142,052 | ||
| Calibration 3 | 142,043 | ||
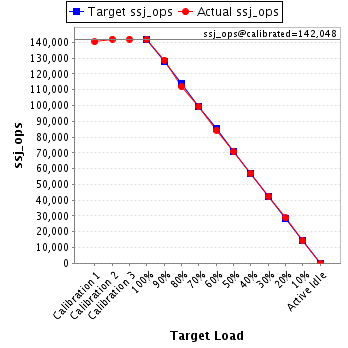
| ssj_ops@calibrated=142,048 | |||
| 100% | 99.9% | 142,048 | 141,899 |
| 90% | 90.6% | 127,843 | 128,756 |
| 80% | 78.9% | 113,638 | 112,008 |
| 70% | 69.9% | 99,433 | 99,281 |
| 60% | 59.4% | 85,229 | 84,341 |
| 50% | 49.7% | 71,024 | 70,627 |
| 40% | 40.3% | 56,819 | 57,181 |
| 30% | 30.0% | 42,614 | 42,552 |
| 20% | 20.2% | 28,410 | 28,703 |
| 10% | 10.0% | 14,205 | 14,160 |
| Active Idle | 0 | 0 | |
| Target Load | Actual Load | ssj_ops | |
|---|---|---|---|
| Target | Actual | ||
| Calibration 1 | 140,446 | ||
| Calibration 2 | 141,432 | ||
| Calibration 3 | 142,095 | ||
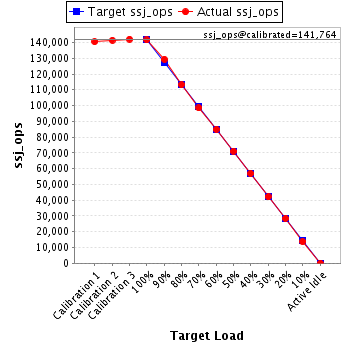
| ssj_ops@calibrated=141,764 | |||
| 100% | 99.9% | 141,764 | 141,602 |
| 90% | 91.3% | 127,587 | 129,367 |
| 80% | 79.8% | 113,411 | 113,110 |
| 70% | 69.5% | 99,234 | 98,483 |
| 60% | 59.9% | 85,058 | 84,979 |
| 50% | 50.2% | 70,882 | 71,151 |
| 40% | 40.2% | 56,705 | 56,919 |
| 30% | 29.7% | 42,529 | 42,105 |
| 20% | 20.1% | 28,353 | 28,436 |
| 10% | 9.7% | 14,176 | 13,750 |
| Active Idle | 0 | 0 | |
| Target Load | Actual Load | ssj_ops | |
|---|---|---|---|
| Target | Actual | ||
| Calibration 1 | 138,264 | ||
| Calibration 2 | 139,480 | ||
| Calibration 3 | 139,047 | ||
| ssj_ops@calibrated=139,264 | |||
| 100% | 99.9% | 139,264 | 139,106 |
| 90% | 90.8% | 125,337 | 126,476 |
| 80% | 80.0% | 111,411 | 111,457 |
| 70% | 70.1% | 97,485 | 97,641 |
| 60% | 60.6% | 83,558 | 84,424 |
| 50% | 49.6% | 69,632 | 69,032 |
| 40% | 40.1% | 55,705 | 55,897 |
| 30% | 30.4% | 41,779 | 42,289 |
| 20% | 19.7% | 27,853 | 27,488 |
| 10% | 10.2% | 13,926 | 14,269 |
| Active Idle | 0 | 0 | |

| Target Load | Actual Load | ssj_ops | |
|---|---|---|---|
| Target | Actual | ||
| Calibration 1 | 138,575 | ||
| Calibration 2 | 139,573 | ||
| Calibration 3 | 139,686 | ||
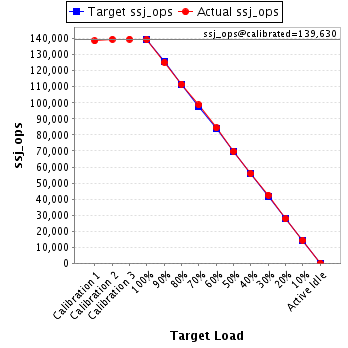
| ssj_ops@calibrated=139,630 | |||
| 100% | 99.8% | 139,630 | 139,330 |
| 90% | 89.7% | 125,667 | 125,259 |
| 80% | 80.0% | 111,704 | 111,675 |
| 70% | 70.7% | 97,741 | 98,672 |
| 60% | 60.5% | 83,778 | 84,415 |
| 50% | 49.9% | 69,815 | 69,744 |
| 40% | 40.0% | 55,852 | 55,798 |
| 30% | 30.4% | 41,889 | 42,492 |
| 20% | 19.8% | 27,926 | 27,679 |
| 10% | 10.3% | 13,963 | 14,349 |
| Active Idle | 0 | 0 | |
| Target Load | Actual Load | ssj_ops | |
|---|---|---|---|
| Target | Actual | ||
| Calibration 1 | 136,424 | ||
| Calibration 2 | 139,467 | ||
| Calibration 3 | 139,088 | ||
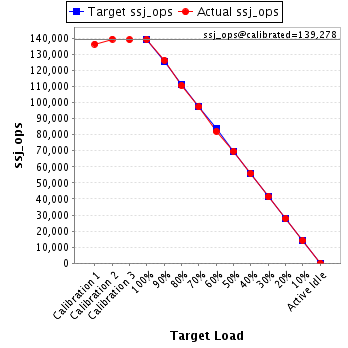
| ssj_ops@calibrated=139,278 | |||
| 100% | 99.9% | 139,278 | 139,200 |
| 90% | 90.7% | 125,350 | 126,379 |
| 80% | 79.4% | 111,422 | 110,532 |
| 70% | 69.9% | 97,494 | 97,297 |
| 60% | 58.9% | 83,567 | 82,068 |
| 50% | 50.1% | 69,639 | 69,751 |
| 40% | 40.1% | 55,711 | 55,822 |
| 30% | 29.7% | 41,783 | 41,398 |
| 20% | 20.0% | 27,856 | 27,786 |
| 10% | 10.2% | 13,928 | 14,143 |
| Active Idle | 0 | 0 | |
| Target Load | Actual Load | ssj_ops | |
|---|---|---|---|
| Target | Actual | ||
| Calibration 1 | 137,494 | ||
| Calibration 2 | 138,249 | ||
| Calibration 3 | 136,973 | ||
| ssj_ops@calibrated=137,611 | |||
| 100% | 101.0% | 137,611 | 138,933 |
| 90% | 90.6% | 123,850 | 124,682 |
| 80% | 80.9% | 110,089 | 111,327 |
| 70% | 70.2% | 96,328 | 96,603 |
| 60% | 60.1% | 82,567 | 82,759 |
| 50% | 49.5% | 68,805 | 68,137 |
| 40% | 40.2% | 55,044 | 55,374 |
| 30% | 30.5% | 41,283 | 41,903 |
| 20% | 20.3% | 27,522 | 27,968 |
| 10% | 9.9% | 13,761 | 13,576 |
| Active Idle | 0 | 0 | |

| Target Load | Actual Load | ssj_ops | |
|---|---|---|---|
| Target | Actual | ||
| Calibration 1 | 137,661 | ||
| Calibration 2 | 140,023 | ||
| Calibration 3 | 139,631 | ||
| ssj_ops@calibrated=139,827 | |||
| 100% | 99.2% | 139,827 | 138,654 |
| 90% | 90.7% | 125,844 | 126,756 |
| 80% | 79.5% | 111,861 | 111,200 |
| 70% | 69.6% | 97,879 | 97,292 |
| 60% | 59.7% | 83,896 | 83,413 |
| 50% | 49.9% | 69,913 | 69,823 |
| 40% | 39.5% | 55,931 | 55,166 |
| 30% | 29.6% | 41,948 | 41,419 |
| 20% | 19.6% | 27,965 | 27,466 |
| 10% | 10.0% | 13,983 | 13,913 |
| Active Idle | 0 | 0 | |

| Target Load | Actual Load | ssj_ops | |
|---|---|---|---|
| Target | Actual | ||
| Calibration 1 | 137,776 | ||
| Calibration 2 | 139,573 | ||
| Calibration 3 | 138,501 | ||
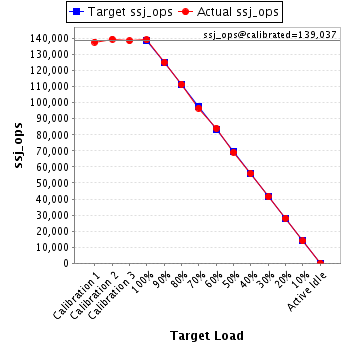
| ssj_ops@calibrated=139,037 | |||
| 100% | 100.1% | 139,037 | 139,160 |
| 90% | 90.0% | 125,133 | 125,180 |
| 80% | 80.2% | 111,229 | 111,451 |
| 70% | 69.5% | 97,326 | 96,652 |
| 60% | 60.5% | 83,422 | 84,120 |
| 50% | 49.7% | 69,518 | 69,155 |
| 40% | 40.2% | 55,615 | 55,852 |
| 30% | 29.8% | 41,711 | 41,437 |
| 20% | 20.2% | 27,807 | 28,100 |
| 10% | 10.0% | 13,904 | 13,876 |
| Active Idle | 0 | 0 | |