SPECpower_ssj2008
Host 'OrcaPT-Power' Performance Report
Copyright © 2007-2012 Standard Performance Evaluation Corporation
| Dell Inc. PowerEdge T620 (Intel Xeon E5-2670, 2.6 GHz) | ssj_ops@100% = 1,236,311 ssj_ops@100% per JVM = 154,539 |
||||
| Test Sponsor: | Dell Inc. | SPEC License #: | 55 | Test Method: | Single Node |
| Tested By: | Dell Inc. | Test Location: | Round Rock, TX, USA | Test Date: | Feb 19, 2012 |
| Hardware Availability: | Mar-2012 | Software Availability: | Dec-2011 | Publication: | Mar 21, 2012 |
| System Source: | Single Supplier | System Designation: | Server | Power Provisioning: | Line-powered |
| Target Load | Actual Load | ssj_ops | |
|---|---|---|---|
| Target | Actual | ||
| Calibration 1 | 1,230,765 | ||
| Calibration 2 | 1,241,742 | ||
| Calibration 3 | 1,240,803 | ||
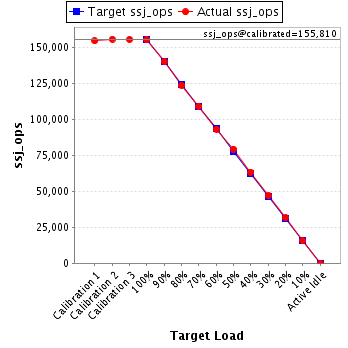
| ssj_ops@calibrated=1,241,273 | |||
| 100% | 99.6% | 1,241,273 | 1,236,311 |
| 90% | 90.0% | 1,117,145 | 1,117,137 |
| 80% | 80.0% | 993,018 | 993,376 |
| 70% | 70.1% | 868,891 | 869,920 |
| 60% | 59.9% | 744,764 | 743,742 |
| 50% | 50.1% | 620,636 | 622,238 |
| 40% | 40.2% | 496,509 | 499,306 |
| 30% | 30.1% | 372,382 | 373,999 |
| 20% | 20.0% | 248,255 | 248,792 |
| 10% | 10.0% | 124,127 | 123,810 |
| Active Idle | 0 | 0 | |
| Set Identifier: | sut |
| Set Description: | System Under Test |
| # of Identical Nodes: | 1 |
| Comment: | PowerEdge T620 |
| Hardware | |
|---|---|
| Hardware Vendor: | Dell Inc. |
| Model: | PowerEdge T620 (Intel Xeon E5-2670, 2.6 GHz) |
| Form Factor: | Tower |
| CPU Name: | Intel Xeon E5-2670 2.60 GHz |
| CPU Characteristics: | 8 core, 2.6GHz, 20MB L3 Cache |
| CPU Frequency (MHz): | 2600 |
| CPU(s) Enabled: | 16 cores, 2 chips, 8 cores/chip |
| Hardware Threads: | 32 (2 / core) |
| CPU(s) Orderable: | 1,2 chips |
| Primary Cache: | 32 KB I + 32 KB D on chip per core |
| Secondary Cache: | 256 KB I+D on chip per core |
| Tertiary Cache: | 20 MB I+D on chip per chip |
| Other Cache: | None |
| Memory Amount (GB): | 24 |
| # and size of DIMM: | 6 x 4096 MB |
| Memory Details: | 4GB 2Rx8 PC3L-10600E-9 ECC; Slots A1-3, B1-3 populated. |
| Power Supply Quantity and Rating (W): | 1 x 495 |
| Power Supply Details: | Dell P/N 13MD5 |
| Disk Drive: | 1 x 100GB SATA SSD, Dell P/N DYW42 |
| Disk Controller: | Onboard PERC S110 |
| # and type of Network Interface Cards (NICs) Installed: | 2 x Onboard Dual Port Intel I350 |
| NICs Enabled in Firmware / OS / Connected: | 2/2/1 |
| Network Speed (Mbit): | 1000 |
| Keyboard: | None |
| Mouse: | None |
| Monitor: | None |
| Optical Drives: | No |
| Other Hardware: | None |
| Software | |
|---|---|
| Power Management: | Power Saver plan set in OS |
| Operating System (OS): | Microsoft Windows 2008 Enterprise x64 Edition |
| OS Version: | R2 SP1 |
| Filesystem: | NTFS |
| JVM Vendor: | Oracle Corporation |
| JVM Version: | Oracle Java HotSpot(TM) 64-Bit Server VM on Windows, version 1.6.0_30 |
| JVM Command-line Options: | -server -Xmx2g -Xms2g -Xmn1700m -XX:SurvivorRatio=60 -XX:TargetSurvivorRatio=90 -XX:ParallelGCThreads=4 -XX:AllocatePrefetchDistance=256 -XX:AllocatePrefetchLines=4 -XX:LoopUnrollLimit=45 -XX:InitialTenuringThreshold=12 -XX:MaxTenuringThreshold=15 -XX:InlineSmallCode=3900 -XX:MaxInlineSize=270 -XX:FreqInlineSize=2500 -XX:+UseLargePages -XX:+UseParallelOldGC -XX:+UseCompressedStrings -XX:+AggressiveOpts |
| JVM Affinity: | start /affinity [F,F0,F00,F000,F0000,F00000,F000000,F0000000] |
| JVM Instances: | 8 |
| JVM Initial Heap (MB): | 2048 |
| JVM Maximum Heap (MB): | 2048 |
| JVM Address Bits: | 64 |
| Boot Firmware Version: | 1.0.3 |
| Management Firmware Version: | X48 Build 73 |
| Workload Version: | SSJ 1.2.9 |
| Director Location: | Controller |
| Other Software: | None |
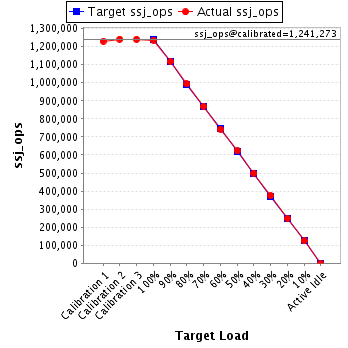
| JVM Instance | ssj_ops@100% |
|---|---|
| OrcaPT-Power.001 | 156,047 |
| OrcaPT-Power.002 | 153,804 |
| OrcaPT-Power.003 | 153,455 |
| OrcaPT-Power.004 | 154,242 |
| OrcaPT-Power.005 | 154,076 |
| OrcaPT-Power.006 | 155,065 |
| OrcaPT-Power.007 | 154,080 |
| OrcaPT-Power.008 | 155,541 |
| ssj_ops@100% | 1,236,311 |
| ssj_ops@100% per JVM | 154,539 |
| Target Load | Actual Load | ssj_ops | |
|---|---|---|---|
| Target | Actual | ||
| Calibration 1 | 153,598 | ||
| Calibration 2 | 155,879 | ||
| Calibration 3 | 155,475 | ||
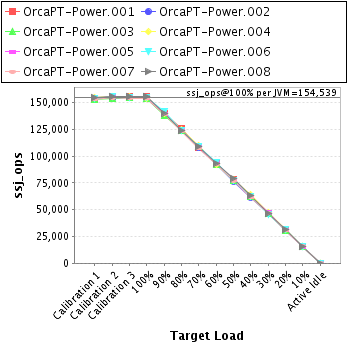
| ssj_ops@calibrated=155,677 | |||
| 100% | 100.2% | 155,677 | 156,047 |
| 90% | 89.8% | 140,109 | 139,747 |
| 80% | 80.6% | 124,541 | 125,531 |
| 70% | 69.5% | 108,974 | 108,225 |
| 60% | 59.8% | 93,406 | 93,108 |
| 50% | 50.0% | 77,838 | 77,861 |
| 40% | 40.0% | 62,271 | 62,222 |
| 30% | 29.9% | 46,703 | 46,583 |
| 20% | 20.1% | 31,135 | 31,348 |
| 10% | 9.9% | 15,568 | 15,458 |
| Active Idle | 0 | 0 | |
| Target Load | Actual Load | ssj_ops | |
|---|---|---|---|
| Target | Actual | ||
| Calibration 1 | 153,440 | ||
| Calibration 2 | 153,702 | ||
| Calibration 3 | 154,414 | ||
| ssj_ops@calibrated=154,058 | |||
| 100% | 99.8% | 154,058 | 153,804 |
| 90% | 90.0% | 138,652 | 138,703 |
| 80% | 80.4% | 123,246 | 123,911 |
| 70% | 70.2% | 107,841 | 108,166 |
| 60% | 59.7% | 92,435 | 92,043 |
| 50% | 49.7% | 77,029 | 76,613 |
| 40% | 40.0% | 61,623 | 61,664 |
| 30% | 30.3% | 46,217 | 46,604 |
| 20% | 19.9% | 30,812 | 30,661 |
| 10% | 9.9% | 15,406 | 15,291 |
| Active Idle | 0 | 0 | |

| Target Load | Actual Load | ssj_ops | |
|---|---|---|---|
| Target | Actual | ||
| Calibration 1 | 153,166 | ||
| Calibration 2 | 154,324 | ||
| Calibration 3 | 154,919 | ||
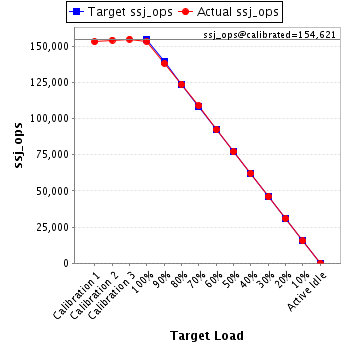
| ssj_ops@calibrated=154,621 | |||
| 100% | 99.2% | 154,621 | 153,455 |
| 90% | 89.4% | 139,159 | 138,298 |
| 80% | 80.0% | 123,697 | 123,626 |
| 70% | 70.4% | 108,235 | 108,889 |
| 60% | 59.8% | 92,773 | 92,431 |
| 50% | 49.8% | 77,311 | 77,049 |
| 40% | 40.2% | 61,849 | 62,104 |
| 30% | 29.8% | 46,386 | 46,050 |
| 20% | 20.1% | 30,924 | 31,025 |
| 10% | 10.0% | 15,462 | 15,417 |
| Active Idle | 0 | 0 | |
| Target Load | Actual Load | ssj_ops | |
|---|---|---|---|
| Target | Actual | ||
| Calibration 1 | 154,988 | ||
| Calibration 2 | 155,822 | ||
| Calibration 3 | 155,699 | ||
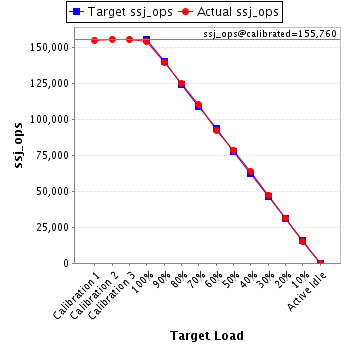
| ssj_ops@calibrated=155,760 | |||
| 100% | 99.0% | 155,760 | 154,242 |
| 90% | 89.8% | 140,184 | 139,809 |
| 80% | 80.2% | 124,608 | 124,911 |
| 70% | 70.7% | 109,032 | 110,093 |
| 60% | 59.4% | 93,456 | 92,557 |
| 50% | 50.3% | 77,880 | 78,358 |
| 40% | 41.1% | 62,304 | 63,940 |
| 30% | 30.4% | 46,728 | 47,423 |
| 20% | 20.0% | 31,152 | 31,096 |
| 10% | 9.8% | 15,576 | 15,209 |
| Active Idle | 0 | 0 | |
| Target Load | Actual Load | ssj_ops | |
|---|---|---|---|
| Target | Actual | ||
| Calibration 1 | 154,186 | ||
| Calibration 2 | 156,026 | ||
| Calibration 3 | 155,404 | ||
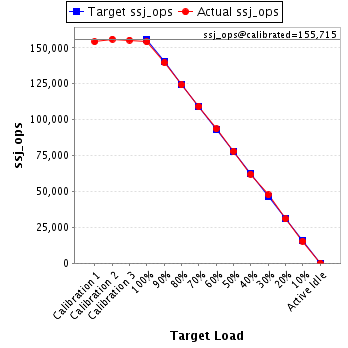
| ssj_ops@calibrated=155,715 | |||
| 100% | 98.9% | 155,715 | 154,076 |
| 90% | 89.7% | 140,143 | 139,714 |
| 80% | 79.7% | 124,572 | 124,148 |
| 70% | 70.1% | 109,000 | 109,228 |
| 60% | 60.1% | 93,429 | 93,546 |
| 50% | 50.2% | 77,857 | 78,119 |
| 40% | 39.8% | 62,286 | 62,006 |
| 30% | 30.6% | 46,714 | 47,635 |
| 20% | 19.8% | 31,143 | 30,830 |
| 10% | 9.9% | 15,571 | 15,376 |
| Active Idle | 0 | 0 | |
| Target Load | Actual Load | ssj_ops | |
|---|---|---|---|
| Target | Actual | ||
| Calibration 1 | 153,649 | ||
| Calibration 2 | 155,573 | ||
| Calibration 3 | 155,170 | ||
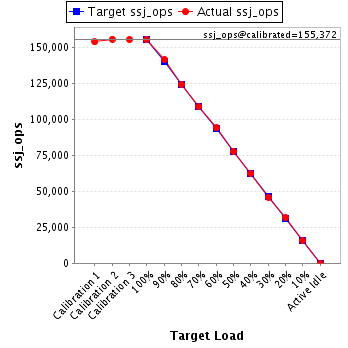
| ssj_ops@calibrated=155,372 | |||
| 100% | 99.8% | 155,372 | 155,065 |
| 90% | 91.1% | 139,835 | 141,544 |
| 80% | 79.8% | 124,297 | 123,979 |
| 70% | 69.9% | 108,760 | 108,610 |
| 60% | 60.5% | 93,223 | 93,986 |
| 50% | 50.0% | 77,686 | 77,614 |
| 40% | 40.2% | 62,149 | 62,462 |
| 30% | 29.6% | 46,612 | 45,951 |
| 20% | 20.3% | 31,074 | 31,493 |
| 10% | 10.1% | 15,537 | 15,676 |
| Active Idle | 0 | 0 | |
| Target Load | Actual Load | ssj_ops | |
|---|---|---|---|
| Target | Actual | ||
| Calibration 1 | 153,091 | ||
| Calibration 2 | 154,499 | ||
| Calibration 3 | 154,020 | ||
| ssj_ops@calibrated=154,259 | |||
| 100% | 99.9% | 154,259 | 154,080 |
| 90% | 90.1% | 138,834 | 138,988 |
| 80% | 80.0% | 123,408 | 123,399 |
| 70% | 69.6% | 107,982 | 107,426 |
| 60% | 60.1% | 92,556 | 92,705 |
| 50% | 50.0% | 77,130 | 77,144 |
| 40% | 39.9% | 61,704 | 61,478 |
| 30% | 30.4% | 46,278 | 46,909 |
| 20% | 20.0% | 30,852 | 30,838 |
| 10% | 10.3% | 15,426 | 15,859 |
| Active Idle | 0 | 0 | |

| Target Load | Actual Load | ssj_ops | |
|---|---|---|---|
| Target | Actual | ||
| Calibration 1 | 154,647 | ||
| Calibration 2 | 155,917 | ||
| Calibration 3 | 155,703 | ||
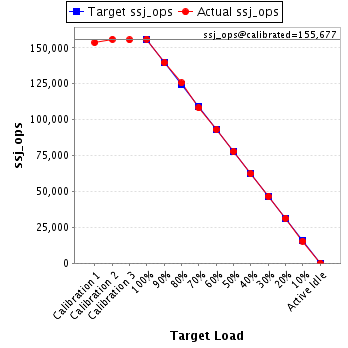
| ssj_ops@calibrated=155,810 | |||
| 100% | 99.8% | 155,810 | 155,541 |
| 90% | 90.1% | 140,229 | 140,335 |
| 80% | 79.5% | 124,648 | 123,870 |
| 70% | 70.1% | 109,067 | 109,284 |
| 60% | 59.9% | 93,486 | 93,365 |
| 50% | 51.0% | 77,905 | 79,478 |
| 40% | 40.7% | 62,324 | 63,428 |
| 30% | 30.1% | 46,743 | 46,844 |
| 20% | 20.2% | 31,162 | 31,501 |
| 10% | 10.0% | 15,581 | 15,524 |
| Active Idle | 0 | 0 | |