SPECpower_ssj2008
Host 'ramsey1' Performance Report
Copyright © 2007-2012 Standard Performance Evaluation Corporation
| SGI Rackable C2112-4G10 | ssj_ops@100% = 1,185,188 ssj_ops@100% per JVM = 74,074 |
||||
| Test Sponsor: | SGI | SPEC License #: | 4 | Test Method: | Multi Node |
| Tested By: | SGI | Test Location: | Fremont, CA, USA | Test Date: | Feb 25, 2012 |
| Hardware Availability: | Apr-2012 | Software Availability: | Apr-2012 | Publication: | Mar 21, 2012 |
| System Source: | Single Supplier | System Designation: | Server | Power Provisioning: | Line-powered |
| Target Load | Actual Load | ssj_ops | |
|---|---|---|---|
| Target | Actual | ||
| Calibration 1 | 1,171,209 | ||
| Calibration 2 | 1,192,131 | ||
| Calibration 3 | 1,194,006 | ||
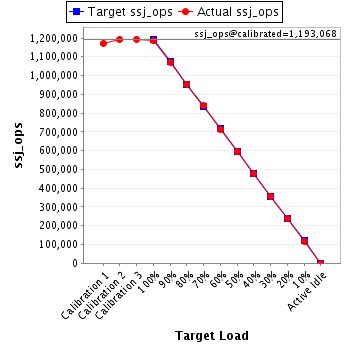
| ssj_ops@calibrated=1,193,068 | |||
| 100% | 99.3% | 1,193,068 | 1,185,188 |
| 90% | 89.8% | 1,073,762 | 1,071,550 |
| 80% | 79.9% | 954,455 | 953,635 |
| 70% | 70.3% | 835,148 | 838,374 |
| 60% | 59.9% | 715,841 | 714,879 |
| 50% | 50.0% | 596,534 | 596,169 |
| 40% | 39.9% | 477,227 | 476,554 |
| 30% | 30.0% | 357,921 | 357,934 |
| 20% | 20.0% | 238,614 | 238,513 |
| 10% | 9.9% | 119,307 | 118,572 |
| Active Idle | 0 | 0 | |
| Set Identifier: | sut |
| Set Description: | Rackable C2112-4G10 |
| # of Identical Nodes: | 4 |
| Comment: | None |
| Hardware | |
|---|---|
| Hardware Vendor: | SGI |
| Model: | Rackable C2112-4G10 |
| Form Factor: | Blade |
| CPU Name: | AMD Opteron 6276 |
| CPU Characteristics: | 16 cores, 2.30 GHz (AMD Turbo CORE technology upto 3.20 GHz) |
| CPU Frequency (MHz): | 2300 |
| CPU(s) Enabled: | 32 cores, 2 chips, 16 cores/chip |
| Hardware Threads: | 32 (1 / core) |
| CPU(s) Orderable: | 1,2 chips |
| Primary Cache: | 512 KB I + 256 KB D on chip per chip |
| Secondary Cache: | 16 MB I+D on chip per chip, 2 MB shared / 2 cores |
| Tertiary Cache: | 16 MB I+D on chip per chip, 8 MB shared / 8 cores |
| Other Cache: | None |
| Memory Amount (GB): | 32 |
| # and size of DIMM: | 8 x 4096 MB |
| Memory Details: | 4 GB 2Rx8 PC3L-10600R; slots 1A, 2A, 3A, and 4A populated for each processor |
| Power Supply Quantity and Rating (W): | None |
| Power Supply Details: | Shared |
| Disk Drive: | 1 x 120 GB 2.5" SSD SATA (SGI PN LSX-SSD25-120G-I) |
| Disk Controller: | Integrated SATA controller |
| # and type of Network Interface Cards (NICs) Installed: | 2 x Integrated Intel 82576 Gigabit Ethernet |
| NICs Enabled in Firmware / OS / Connected: | 2/2/1 |
| Network Speed (Mbit): | 1000 |
| Keyboard: | None |
| Mouse: | None |
| Monitor: | None |
| Optical Drives: | No |
| Other Hardware: | None |
| Software | |
|---|---|
| Power Management: | Power Saver Enabled in OS |
| Operating System (OS): | Microsoft Windows Server 2008 Datacenter Edition |
| OS Version: | R2 |
| Filesystem: | NTFS |
| JVM Vendor: | IBM Corporation |
| JVM Version: | IBM J9 VM (build 2.4, JRE 1.6.0 IBM J9 2.4 Windows Server 2008 amd64-64 jvmwa6460sr7-20091214_49398 (JIT enabled, AOT enabled) |
| JVM Command-line Options: | -Xmn1400m -Xms1600m -Xmx1600m -Xaggressive -Xcompressedrefs -Xgcpolicy:gencon -XlockReservation -Xnoloa -Xlp |
| JVM Affinity: | start /affinity [0x3,0xC,0x30,0xc0,0x300,0xC00,0x3000,0xC000,0x30000,0xC0000,0x300000,0xC00000,0x3000000,0xC000000,0x30000000,0xC0000000] |
| JVM Instances: | 16 |
| JVM Initial Heap (MB): | 1600 |
| JVM Maximum Heap (MB): | 1600 |
| JVM Address Bits: | 64 |
| Boot Firmware Version: | 2.0 dt 10/03/11 |
| Management Firmware Version: | none |
| Workload Version: | SSJ 1.2.9 |
| Director Location: | Controller |
| Other Software: | IBM Websphere Application Server Community Edition V2.1.1.4 for windows on X86-64bit |
| JVM Instance | ssj_ops@100% |
|---|---|
| ramsey1.001 | 74,962 |
| ramsey1.002 | 73,913 |
| ramsey1.003 | 74,530 |
| ramsey1.004 | 73,910 |
| ramsey1.005 | 73,924 |
| ramsey1.006 | 73,886 |
| ramsey1.007 | 73,325 |
| ramsey1.008 | 73,673 |
| ramsey1.009 | 73,912 |
| ramsey1.010 | 74,327 |
| ramsey1.011 | 73,921 |
| ramsey1.012 | 74,080 |
| ramsey1.013 | 73,212 |
| ramsey1.014 | 74,674 |
| ramsey1.015 | 74,670 |
| ramsey1.016 | 74,270 |
| ssj_ops@100% | 1,185,188 |
| ssj_ops@100% per JVM | 74,074 |
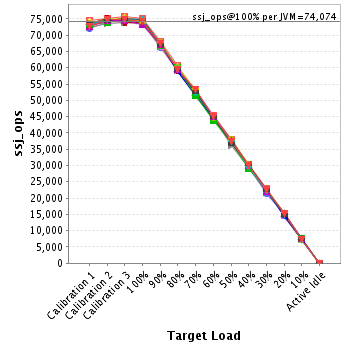
| Target Load | Actual Load | ssj_ops | |
|---|---|---|---|
| Target | Actual | ||
| Calibration 1 | 74,502 | ||
| Calibration 2 | 75,236 | ||
| Calibration 3 | 75,758 | ||
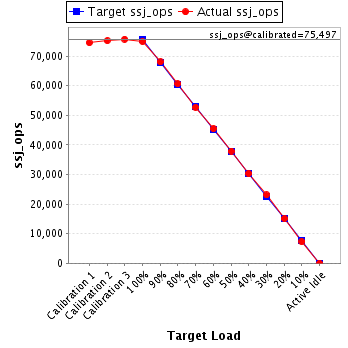
| ssj_ops@calibrated=75,497 | |||
| 100% | 99.3% | 75,497 | 74,962 |
| 90% | 90.1% | 67,947 | 68,052 |
| 80% | 80.3% | 60,398 | 60,647 |
| 70% | 69.9% | 52,848 | 52,753 |
| 60% | 60.2% | 45,298 | 45,457 |
| 50% | 50.2% | 37,749 | 37,913 |
| 40% | 40.1% | 30,199 | 30,299 |
| 30% | 30.6% | 22,649 | 23,078 |
| 20% | 20.0% | 15,099 | 15,079 |
| 10% | 9.7% | 7,550 | 7,316 |
| Active Idle | 0 | 0 | |
| Target Load | Actual Load | ssj_ops | |
|---|---|---|---|
| Target | Actual | ||
| Calibration 1 | 71,973 | ||
| Calibration 2 | 74,268 | ||
| Calibration 3 | 74,443 | ||
| ssj_ops@calibrated=74,356 | |||
| 100% | 99.4% | 74,356 | 73,913 |
| 90% | 89.0% | 66,920 | 66,180 |
| 80% | 79.8% | 59,485 | 59,355 |
| 70% | 69.3% | 52,049 | 51,502 |
| 60% | 59.6% | 44,614 | 44,303 |
| 50% | 50.0% | 37,178 | 37,193 |
| 40% | 39.8% | 29,742 | 29,620 |
| 30% | 28.9% | 22,307 | 21,468 |
| 20% | 20.0% | 14,871 | 14,887 |
| 10% | 9.8% | 7,436 | 7,321 |
| Active Idle | 0 | 0 | |

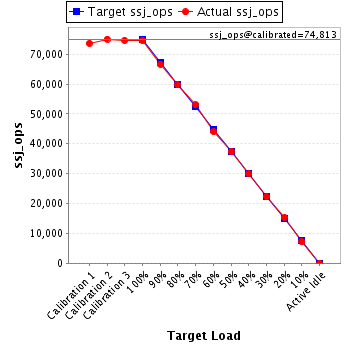
| Target Load | Actual Load | ssj_ops | |
|---|---|---|---|
| Target | Actual | ||
| Calibration 1 | 73,633 | ||
| Calibration 2 | 75,007 | ||
| Calibration 3 | 74,619 | ||
| ssj_ops@calibrated=74,813 | |||
| 100% | 99.6% | 74,813 | 74,530 |
| 90% | 89.0% | 67,332 | 66,599 |
| 80% | 79.8% | 59,851 | 59,715 |
| 70% | 70.9% | 52,369 | 53,053 |
| 60% | 58.9% | 44,888 | 44,089 |
| 50% | 50.1% | 37,407 | 37,445 |
| 40% | 40.0% | 29,925 | 29,897 |
| 30% | 29.7% | 22,444 | 22,255 |
| 20% | 20.5% | 14,963 | 15,310 |
| 10% | 9.6% | 7,481 | 7,179 |
| Active Idle | 0 | 0 | |
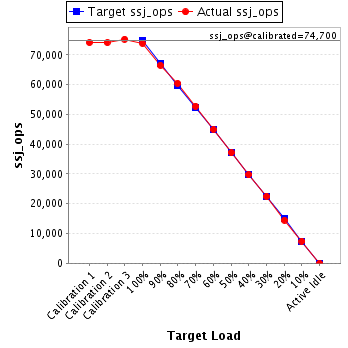
| Target Load | Actual Load | ssj_ops | |
|---|---|---|---|
| Target | Actual | ||
| Calibration 1 | 74,167 | ||
| Calibration 2 | 74,118 | ||
| Calibration 3 | 75,283 | ||
| ssj_ops@calibrated=74,700 | |||
| 100% | 98.9% | 74,700 | 73,910 |
| 90% | 89.0% | 67,230 | 66,509 |
| 80% | 80.9% | 59,760 | 60,435 |
| 70% | 70.6% | 52,290 | 52,770 |
| 60% | 60.2% | 44,820 | 44,983 |
| 50% | 49.7% | 37,350 | 37,147 |
| 40% | 39.8% | 29,880 | 29,734 |
| 30% | 30.1% | 22,410 | 22,509 |
| 20% | 19.4% | 14,940 | 14,509 |
| 10% | 9.9% | 7,470 | 7,404 |
| Active Idle | 0 | 0 | |
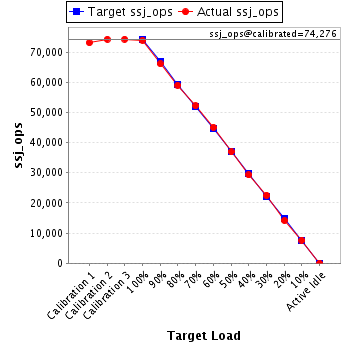
| Target Load | Actual Load | ssj_ops | |
|---|---|---|---|
| Target | Actual | ||
| Calibration 1 | 73,055 | ||
| Calibration 2 | 74,257 | ||
| Calibration 3 | 74,296 | ||
| ssj_ops@calibrated=74,276 | |||
| 100% | 99.5% | 74,276 | 73,924 |
| 90% | 89.0% | 66,848 | 66,106 |
| 80% | 79.5% | 59,421 | 59,028 |
| 70% | 70.2% | 51,993 | 52,173 |
| 60% | 60.6% | 44,566 | 45,037 |
| 50% | 49.7% | 37,138 | 36,949 |
| 40% | 39.4% | 29,710 | 29,282 |
| 30% | 30.4% | 22,283 | 22,555 |
| 20% | 19.1% | 14,855 | 14,191 |
| 10% | 10.3% | 7,428 | 7,641 |
| Active Idle | 0 | 0 | |
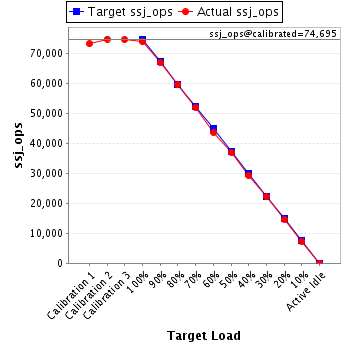
| Target Load | Actual Load | ssj_ops | |
|---|---|---|---|
| Target | Actual | ||
| Calibration 1 | 73,218 | ||
| Calibration 2 | 74,769 | ||
| Calibration 3 | 74,622 | ||
| ssj_ops@calibrated=74,695 | |||
| 100% | 98.9% | 74,695 | 73,886 |
| 90% | 89.5% | 67,226 | 66,869 |
| 80% | 79.7% | 59,756 | 59,543 |
| 70% | 69.6% | 52,287 | 51,997 |
| 60% | 58.4% | 44,817 | 43,656 |
| 50% | 49.5% | 37,348 | 36,960 |
| 40% | 39.2% | 29,878 | 29,313 |
| 30% | 29.6% | 22,409 | 22,139 |
| 20% | 19.6% | 14,939 | 14,670 |
| 10% | 9.8% | 7,470 | 7,296 |
| Active Idle | 0 | 0 | |
| Target Load | Actual Load | ssj_ops | |
|---|---|---|---|
| Target | Actual | ||
| Calibration 1 | 72,372 | ||
| Calibration 2 | 74,071 | ||
| Calibration 3 | 73,856 | ||
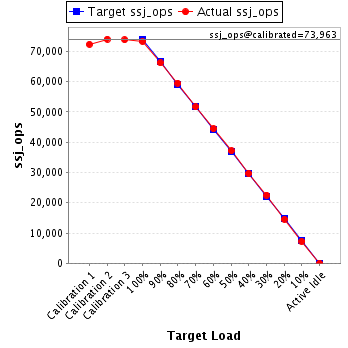
| ssj_ops@calibrated=73,963 | |||
| 100% | 99.1% | 73,963 | 73,325 |
| 90% | 89.6% | 66,567 | 66,246 |
| 80% | 80.5% | 59,171 | 59,558 |
| 70% | 69.9% | 51,774 | 51,676 |
| 60% | 60.1% | 44,378 | 44,448 |
| 50% | 50.3% | 36,982 | 37,169 |
| 40% | 40.1% | 29,585 | 29,659 |
| 30% | 30.5% | 22,189 | 22,557 |
| 20% | 19.7% | 14,793 | 14,562 |
| 10% | 9.8% | 7,396 | 7,246 |
| Active Idle | 0 | 0 | |
| Target Load | Actual Load | ssj_ops | |
|---|---|---|---|
| Target | Actual | ||
| Calibration 1 | 72,231 | ||
| Calibration 2 | 73,675 | ||
| Calibration 3 | 73,761 | ||
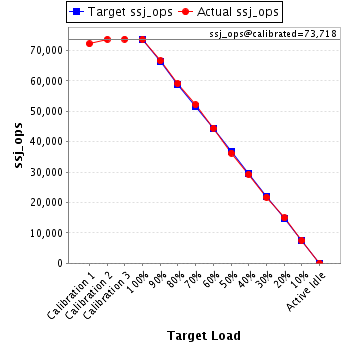
| ssj_ops@calibrated=73,718 | |||
| 100% | 99.9% | 73,718 | 73,673 |
| 90% | 90.4% | 66,346 | 66,620 |
| 80% | 80.2% | 58,974 | 59,143 |
| 70% | 70.8% | 51,602 | 52,183 |
| 60% | 60.3% | 44,231 | 44,467 |
| 50% | 49.2% | 36,859 | 36,262 |
| 40% | 39.7% | 29,487 | 29,245 |
| 30% | 29.6% | 22,115 | 21,787 |
| 20% | 20.2% | 14,744 | 14,924 |
| 10% | 10.1% | 7,372 | 7,474 |
| Active Idle | 0 | 0 | |
| Target Load | Actual Load | ssj_ops | |
|---|---|---|---|
| Target | Actual | ||
| Calibration 1 | 73,609 | ||
| Calibration 2 | 75,055 | ||
| Calibration 3 | 73,840 | ||
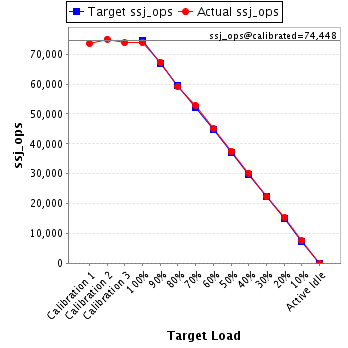
| ssj_ops@calibrated=74,448 | |||
| 100% | 99.3% | 74,448 | 73,912 |
| 90% | 90.5% | 67,003 | 67,383 |
| 80% | 79.4% | 59,558 | 59,118 |
| 70% | 71.0% | 52,113 | 52,892 |
| 60% | 60.5% | 44,669 | 45,044 |
| 50% | 50.4% | 37,224 | 37,519 |
| 40% | 40.6% | 29,779 | 30,193 |
| 30% | 30.0% | 22,334 | 22,307 |
| 20% | 20.5% | 14,890 | 15,239 |
| 10% | 10.2% | 7,445 | 7,583 |
| Active Idle | 0 | 0 | |
| Target Load | Actual Load | ssj_ops | |
|---|---|---|---|
| Target | Actual | ||
| Calibration 1 | 73,359 | ||
| Calibration 2 | 74,561 | ||
| Calibration 3 | 74,481 | ||
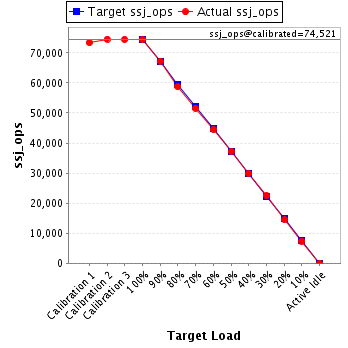
| ssj_ops@calibrated=74,521 | |||
| 100% | 99.7% | 74,521 | 74,327 |
| 90% | 90.3% | 67,069 | 67,284 |
| 80% | 78.9% | 59,617 | 58,781 |
| 70% | 69.2% | 52,165 | 51,564 |
| 60% | 59.7% | 44,713 | 44,517 |
| 50% | 50.0% | 37,261 | 37,284 |
| 40% | 40.1% | 29,808 | 29,908 |
| 30% | 30.1% | 22,356 | 22,418 |
| 20% | 19.4% | 14,904 | 14,479 |
| 10% | 9.9% | 7,452 | 7,379 |
| Active Idle | 0 | 0 | |
| Target Load | Actual Load | ssj_ops | |
|---|---|---|---|
| Target | Actual | ||
| Calibration 1 | 73,151 | ||
| Calibration 2 | 73,985 | ||
| Calibration 3 | 74,765 | ||
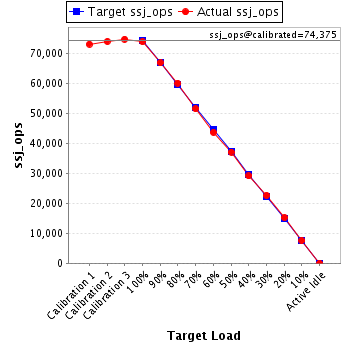
| ssj_ops@calibrated=74,375 | |||
| 100% | 99.4% | 74,375 | 73,921 |
| 90% | 90.0% | 66,937 | 66,911 |
| 80% | 80.8% | 59,500 | 60,093 |
| 70% | 69.3% | 52,062 | 51,517 |
| 60% | 58.7% | 44,625 | 43,689 |
| 50% | 49.9% | 37,187 | 37,102 |
| 40% | 39.2% | 29,750 | 29,120 |
| 30% | 30.5% | 22,312 | 22,668 |
| 20% | 20.5% | 14,875 | 15,224 |
| 10% | 10.2% | 7,437 | 7,610 |
| Active Idle | 0 | 0 | |
| Target Load | Actual Load | ssj_ops | |
|---|---|---|---|
| Target | Actual | ||
| Calibration 1 | 73,676 | ||
| Calibration 2 | 74,708 | ||
| Calibration 3 | 75,039 | ||
| ssj_ops@calibrated=74,873 | |||
| 100% | 98.9% | 74,873 | 74,080 |
| 90% | 90.3% | 67,386 | 67,629 |
| 80% | 80.3% | 59,899 | 60,097 |
| 70% | 71.2% | 52,411 | 53,275 |
| 60% | 59.9% | 44,924 | 44,829 |
| 50% | 50.8% | 37,437 | 38,018 |
| 40% | 40.4% | 29,949 | 30,268 |
| 30% | 30.1% | 22,462 | 22,541 |
| 20% | 20.6% | 14,975 | 15,392 |
| 10% | 9.8% | 7,487 | 7,350 |
| Active Idle | 0 | 0 | |

| Target Load | Actual Load | ssj_ops | |
|---|---|---|---|
| Target | Actual | ||
| Calibration 1 | 72,554 | ||
| Calibration 2 | 74,464 | ||
| Calibration 3 | 74,572 | ||
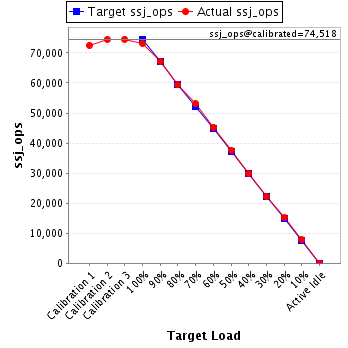
| ssj_ops@calibrated=74,518 | |||
| 100% | 98.2% | 74,518 | 73,212 |
| 90% | 90.2% | 67,066 | 67,204 |
| 80% | 79.6% | 59,614 | 59,323 |
| 70% | 71.2% | 52,163 | 53,071 |
| 60% | 60.6% | 44,711 | 45,175 |
| 50% | 50.4% | 37,259 | 37,589 |
| 40% | 40.1% | 29,807 | 29,877 |
| 30% | 29.7% | 22,355 | 22,145 |
| 20% | 20.3% | 14,904 | 15,147 |
| 10% | 10.4% | 7,452 | 7,750 |
| Active Idle | 0 | 0 | |
| Target Load | Actual Load | ssj_ops | |
|---|---|---|---|
| Target | Actual | ||
| Calibration 1 | 73,116 | ||
| Calibration 2 | 74,698 | ||
| Calibration 3 | 74,676 | ||
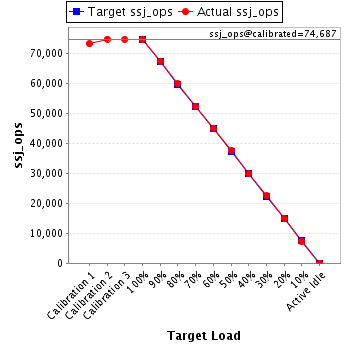
| ssj_ops@calibrated=74,687 | |||
| 100% | 100.0% | 74,687 | 74,674 |
| 90% | 90.3% | 67,218 | 67,418 |
| 80% | 80.1% | 59,750 | 59,828 |
| 70% | 70.0% | 52,281 | 52,256 |
| 60% | 60.3% | 44,812 | 45,043 |
| 50% | 50.2% | 37,343 | 37,488 |
| 40% | 39.9% | 29,875 | 29,774 |
| 30% | 30.1% | 22,406 | 22,455 |
| 20% | 20.2% | 14,937 | 15,054 |
| 10% | 9.7% | 7,469 | 7,271 |
| Active Idle | 0 | 0 | |
| Target Load | Actual Load | ssj_ops | |
|---|---|---|---|
| Target | Actual | ||
| Calibration 1 | 73,815 | ||
| Calibration 2 | 74,460 | ||
| Calibration 3 | 75,087 | ||
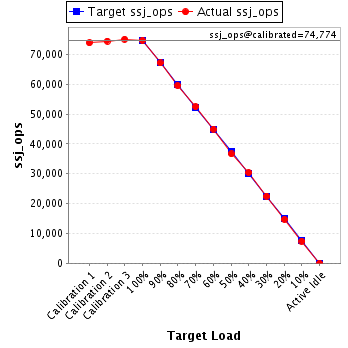
| ssj_ops@calibrated=74,774 | |||
| 100% | 99.9% | 74,774 | 74,670 |
| 90% | 89.8% | 67,296 | 67,111 |
| 80% | 79.6% | 59,819 | 59,516 |
| 70% | 70.1% | 52,342 | 52,434 |
| 60% | 60.1% | 44,864 | 44,968 |
| 50% | 49.0% | 37,387 | 36,661 |
| 40% | 40.6% | 29,909 | 30,387 |
| 30% | 30.1% | 22,432 | 22,522 |
| 20% | 19.6% | 14,955 | 14,693 |
| 10% | 9.9% | 7,477 | 7,412 |
| Active Idle | 0 | 0 | |
| Target Load | Actual Load | ssj_ops | |
|---|---|---|---|
| Target | Actual | ||
| Calibration 1 | 72,779 | ||
| Calibration 2 | 74,800 | ||
| Calibration 3 | 74,908 | ||
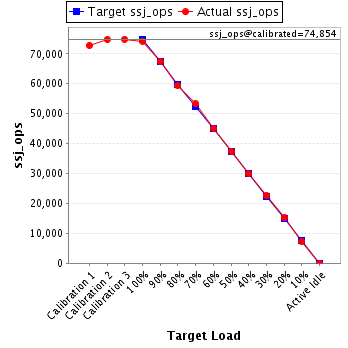
| ssj_ops@calibrated=74,854 | |||
| 100% | 99.2% | 74,854 | 74,270 |
| 90% | 90.1% | 67,369 | 67,428 |
| 80% | 79.4% | 59,883 | 59,454 |
| 70% | 71.1% | 52,398 | 53,258 |
| 60% | 60.3% | 44,912 | 45,172 |
| 50% | 50.1% | 37,427 | 37,470 |
| 40% | 40.0% | 29,942 | 29,978 |
| 30% | 30.1% | 22,456 | 22,528 |
| 20% | 20.2% | 14,971 | 15,154 |
| 10% | 9.8% | 7,485 | 7,341 |
| Active Idle | 0 | 0 | |