
SPECpower_ssj2008
Host 'ramsey2' Performance Report
Copyright © 2007-2012 Standard Performance Evaluation Corporation
| SGI Rackable C2112-4G10 | ssj_ops@100% = 1,194,368 ssj_ops@100% per JVM = 74,648 |
||||
| Test Sponsor: | SGI | SPEC License #: | 4 | Test Method: | Multi Node |
| Tested By: | SGI | Test Location: | Fremont, CA, USA | Test Date: | Feb 25, 2012 |
| Hardware Availability: | Apr-2012 | Software Availability: | Apr-2012 | Publication: | Mar 21, 2012 |
| System Source: | Single Supplier | System Designation: | Server | Power Provisioning: | Line-powered |
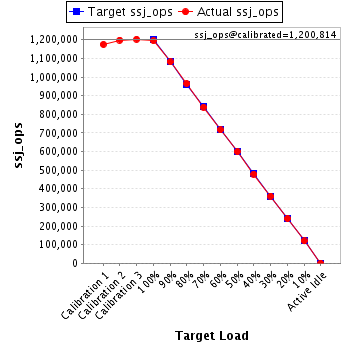
| Target Load | Actual Load | ssj_ops | |
|---|---|---|---|
| Target | Actual | ||
| Calibration 1 | 1,175,404 | ||
| Calibration 2 | 1,198,463 | ||
| Calibration 3 | 1,203,165 | ||
| ssj_ops@calibrated=1,200,814 | |||
| 100% | 99.5% | 1,200,814 | 1,194,368 |
| 90% | 90.0% | 1,080,732 | 1,081,262 |
| 80% | 80.4% | 960,651 | 965,463 |
| 70% | 69.9% | 840,570 | 838,808 |
| 60% | 59.6% | 720,488 | 715,761 |
| 50% | 49.9% | 600,407 | 599,090 |
| 40% | 39.9% | 480,326 | 479,223 |
| 30% | 30.1% | 360,244 | 361,038 |
| 20% | 20.0% | 240,163 | 239,605 |
| 10% | 10.0% | 120,081 | 119,602 |
| Active Idle | 0 | 0 | |
| Set Identifier: | sut |
| Set Description: | Rackable C2112-4G10 |
| # of Identical Nodes: | 4 |
| Comment: | None |
| Hardware | |
|---|---|
| Hardware Vendor: | SGI |
| Model: | Rackable C2112-4G10 |
| Form Factor: | Blade |
| CPU Name: | AMD Opteron 6276 |
| CPU Characteristics: | 16 cores, 2.30 GHz (AMD Turbo CORE technology upto 3.20 GHz) |
| CPU Frequency (MHz): | 2300 |
| CPU(s) Enabled: | 32 cores, 2 chips, 16 cores/chip |
| Hardware Threads: | 32 (1 / core) |
| CPU(s) Orderable: | 1,2 chips |
| Primary Cache: | 512 KB I + 256 KB D on chip per chip |
| Secondary Cache: | 16 MB I+D on chip per chip, 2 MB shared / 2 cores |
| Tertiary Cache: | 16 MB I+D on chip per chip, 8 MB shared / 8 cores |
| Other Cache: | None |
| Memory Amount (GB): | 32 |
| # and size of DIMM: | 8 x 4096 MB |
| Memory Details: | 4 GB 2Rx8 PC3L-10600R; slots 1A, 2A, 3A, and 4A populated for each processor |
| Power Supply Quantity and Rating (W): | None |
| Power Supply Details: | Shared |
| Disk Drive: | 1 x 120 GB 2.5" SSD SATA (SGI PN LSX-SSD25-120G-I) |
| Disk Controller: | Integrated SATA controller |
| # and type of Network Interface Cards (NICs) Installed: | 2 x Integrated Intel 82576 Gigabit Ethernet |
| NICs Enabled in Firmware / OS / Connected: | 2/2/1 |
| Network Speed (Mbit): | 1000 |
| Keyboard: | None |
| Mouse: | None |
| Monitor: | None |
| Optical Drives: | No |
| Other Hardware: | None |
| Software | |
|---|---|
| Power Management: | Power Saver Enabled in OS |
| Operating System (OS): | Microsoft Windows Server 2008 Datacenter Edition |
| OS Version: | R2 |
| Filesystem: | NTFS |
| JVM Vendor: | IBM Corporation |
| JVM Version: | IBM J9 VM (build 2.4, JRE 1.6.0 IBM J9 2.4 Windows Server 2008 amd64-64 jvmwa6460sr7-20091214_49398 (JIT enabled, AOT enabled) |
| JVM Command-line Options: | -Xmn1400m -Xms1600m -Xmx1600m -Xaggressive -Xcompressedrefs -Xgcpolicy:gencon -XlockReservation -Xnoloa -Xlp |
| JVM Affinity: | start /affinity [0x3,0xC,0x30,0xc0,0x300,0xC00,0x3000,0xC000,0x30000,0xC0000,0x300000,0xC00000,0x3000000,0xC000000,0x30000000,0xC0000000] |
| JVM Instances: | 16 |
| JVM Initial Heap (MB): | 1600 |
| JVM Maximum Heap (MB): | 1600 |
| JVM Address Bits: | 64 |
| Boot Firmware Version: | 2.0 dt 10/03/11 |
| Management Firmware Version: | none |
| Workload Version: | SSJ 1.2.9 |
| Director Location: | Controller |
| Other Software: | IBM Websphere Application Server Community Edition V2.1.1.4 for windows on X86-64bit |
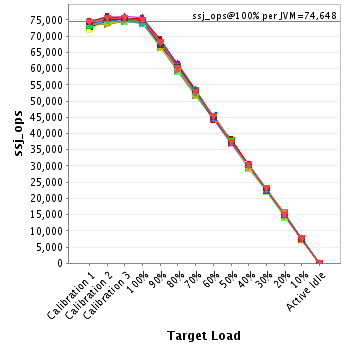
| JVM Instance | ssj_ops@100% |
|---|---|
| ramsey2.001 | 74,762 |
| ramsey2.002 | 74,488 |
| ramsey2.003 | 74,010 |
| ramsey2.004 | 74,379 |
| ramsey2.005 | 74,344 |
| ramsey2.006 | 74,769 |
| ramsey2.007 | 74,407 |
| ramsey2.008 | 73,994 |
| ramsey2.009 | 75,426 |
| ramsey2.010 | 74,767 |
| ramsey2.011 | 74,700 |
| ramsey2.012 | 74,861 |
| ramsey2.013 | 75,833 |
| ramsey2.014 | 73,901 |
| ramsey2.015 | 74,806 |
| ramsey2.016 | 74,920 |
| ssj_ops@100% | 1,194,368 |
| ssj_ops@100% per JVM | 74,648 |
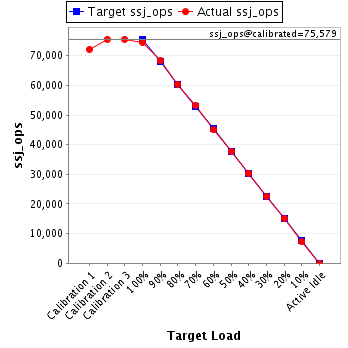
| Target Load | Actual Load | ssj_ops | |
|---|---|---|---|
| Target | Actual | ||
| Calibration 1 | 73,081 | ||
| Calibration 2 | 74,249 | ||
| Calibration 3 | 75,492 | ||
| ssj_ops@calibrated=74,871 | |||
| 100% | 99.9% | 74,871 | 74,762 |
| 90% | 90.9% | 67,384 | 68,041 |
| 80% | 79.1% | 59,897 | 59,192 |
| 70% | 69.9% | 52,409 | 52,342 |
| 60% | 59.3% | 44,922 | 44,367 |
| 50% | 50.5% | 37,435 | 37,783 |
| 40% | 39.9% | 29,948 | 29,880 |
| 30% | 30.4% | 22,461 | 22,792 |
| 20% | 21.0% | 14,974 | 15,704 |
| 10% | 9.9% | 7,487 | 7,392 |
| Active Idle | 0 | 0 | |

| Target Load | Actual Load | ssj_ops | |
|---|---|---|---|
| Target | Actual | ||
| Calibration 1 | 72,133 | ||
| Calibration 2 | 75,545 | ||
| Calibration 3 | 75,613 | ||
| ssj_ops@calibrated=75,579 | |||
| 100% | 98.6% | 75,579 | 74,488 |
| 90% | 90.3% | 68,021 | 68,255 |
| 80% | 79.8% | 60,463 | 60,325 |
| 70% | 70.6% | 52,905 | 53,357 |
| 60% | 59.5% | 45,347 | 44,988 |
| 50% | 50.0% | 37,789 | 37,810 |
| 40% | 40.3% | 30,232 | 30,429 |
| 30% | 29.9% | 22,674 | 22,600 |
| 20% | 20.0% | 15,116 | 15,100 |
| 10% | 9.6% | 7,558 | 7,254 |
| Active Idle | 0 | 0 | |
| Target Load | Actual Load | ssj_ops | |
|---|---|---|---|
| Target | Actual | ||
| Calibration 1 | 73,745 | ||
| Calibration 2 | 74,427 | ||
| Calibration 3 | 74,432 | ||
| ssj_ops@calibrated=74,430 | |||
| 100% | 99.4% | 74,430 | 74,010 |
| 90% | 90.2% | 66,987 | 67,160 |
| 80% | 79.5% | 59,544 | 59,148 |
| 70% | 69.3% | 52,101 | 51,588 |
| 60% | 59.8% | 44,658 | 44,497 |
| 50% | 50.7% | 37,215 | 37,763 |
| 40% | 39.4% | 29,772 | 29,289 |
| 30% | 29.7% | 22,329 | 22,125 |
| 20% | 19.0% | 14,886 | 14,158 |
| 10% | 10.2% | 7,443 | 7,612 |
| Active Idle | 0 | 0 | |

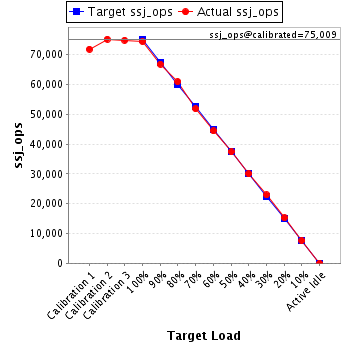
| Target Load | Actual Load | ssj_ops | |
|---|---|---|---|
| Target | Actual | ||
| Calibration 1 | 71,812 | ||
| Calibration 2 | 75,171 | ||
| Calibration 3 | 74,847 | ||
| ssj_ops@calibrated=75,009 | |||
| 100% | 99.2% | 75,009 | 74,379 |
| 90% | 89.0% | 67,508 | 66,791 |
| 80% | 81.2% | 60,007 | 60,908 |
| 70% | 69.1% | 52,506 | 51,806 |
| 60% | 59.2% | 45,005 | 44,382 |
| 50% | 49.8% | 37,504 | 37,379 |
| 40% | 40.0% | 30,003 | 29,973 |
| 30% | 30.5% | 22,503 | 22,904 |
| 20% | 20.3% | 15,002 | 15,216 |
| 10% | 10.1% | 7,501 | 7,604 |
| Active Idle | 0 | 0 | |
| Target Load | Actual Load | ssj_ops | |
|---|---|---|---|
| Target | Actual | ||
| Calibration 1 | 73,585 | ||
| Calibration 2 | 74,848 | ||
| Calibration 3 | 74,924 | ||
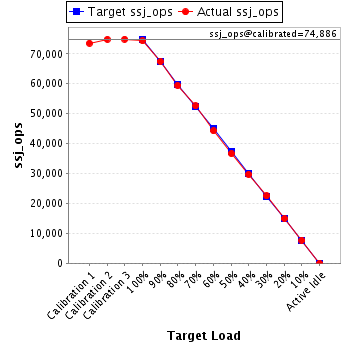
| ssj_ops@calibrated=74,886 | |||
| 100% | 99.3% | 74,886 | 74,344 |
| 90% | 90.1% | 67,398 | 67,471 |
| 80% | 79.4% | 59,909 | 59,431 |
| 70% | 70.2% | 52,420 | 52,591 |
| 60% | 59.1% | 44,932 | 44,259 |
| 50% | 49.0% | 37,443 | 36,669 |
| 40% | 39.7% | 29,954 | 29,733 |
| 30% | 30.0% | 22,466 | 22,493 |
| 20% | 19.9% | 14,977 | 14,938 |
| 10% | 10.3% | 7,489 | 7,687 |
| Active Idle | 0 | 0 | |
| Target Load | Actual Load | ssj_ops | |
|---|---|---|---|
| Target | Actual | ||
| Calibration 1 | 73,846 | ||
| Calibration 2 | 75,435 | ||
| Calibration 3 | 74,993 | ||
| ssj_ops@calibrated=75,214 | |||
| 100% | 99.4% | 75,214 | 74,769 |
| 90% | 90.5% | 67,692 | 68,068 |
| 80% | 80.8% | 60,171 | 60,797 |
| 70% | 69.2% | 52,650 | 52,063 |
| 60% | 59.0% | 45,128 | 44,405 |
| 50% | 49.7% | 37,607 | 37,350 |
| 40% | 40.5% | 30,085 | 30,474 |
| 30% | 30.2% | 22,564 | 22,708 |
| 20% | 20.0% | 15,043 | 15,071 |
| 10% | 10.0% | 7,521 | 7,537 |
| Active Idle | 0 | 0 | |

| Target Load | Actual Load | ssj_ops | |
|---|---|---|---|
| Target | Actual | ||
| Calibration 1 | 73,030 | ||
| Calibration 2 | 74,217 | ||
| Calibration 3 | 74,742 | ||
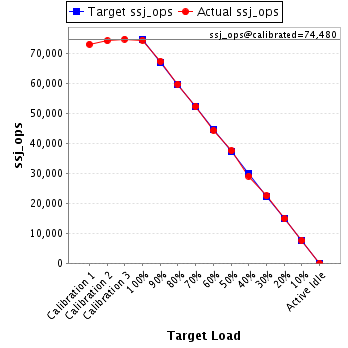
| ssj_ops@calibrated=74,480 | |||
| 100% | 99.9% | 74,480 | 74,407 |
| 90% | 90.4% | 67,032 | 67,321 |
| 80% | 80.2% | 59,584 | 59,712 |
| 70% | 70.2% | 52,136 | 52,318 |
| 60% | 59.5% | 44,688 | 44,344 |
| 50% | 50.4% | 37,240 | 37,556 |
| 40% | 39.0% | 29,792 | 29,050 |
| 30% | 30.1% | 22,344 | 22,440 |
| 20% | 20.0% | 14,896 | 14,866 |
| 10% | 10.2% | 7,448 | 7,583 |
| Active Idle | 0 | 0 | |
| Target Load | Actual Load | ssj_ops | |
|---|---|---|---|
| Target | Actual | ||
| Calibration 1 | 73,467 | ||
| Calibration 2 | 73,485 | ||
| Calibration 3 | 74,625 | ||
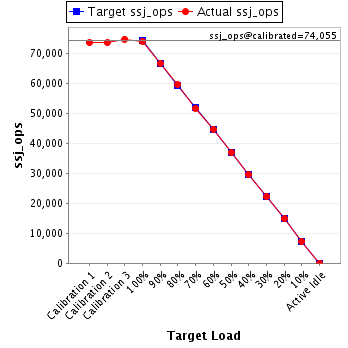
| ssj_ops@calibrated=74,055 | |||
| 100% | 99.9% | 74,055 | 73,994 |
| 90% | 89.9% | 66,649 | 66,599 |
| 80% | 80.3% | 59,244 | 59,452 |
| 70% | 69.6% | 51,838 | 51,571 |
| 60% | 60.3% | 44,433 | 44,684 |
| 50% | 49.8% | 37,027 | 36,894 |
| 40% | 39.8% | 29,622 | 29,500 |
| 30% | 30.1% | 22,216 | 22,279 |
| 20% | 20.1% | 14,811 | 14,864 |
| 10% | 9.7% | 7,405 | 7,216 |
| Active Idle | 0 | 0 | |
| Target Load | Actual Load | ssj_ops | |
|---|---|---|---|
| Target | Actual | ||
| Calibration 1 | 74,605 | ||
| Calibration 2 | 76,125 | ||
| Calibration 3 | 75,515 | ||
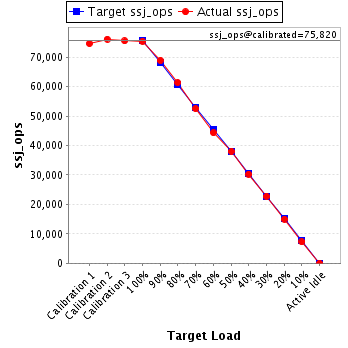
| ssj_ops@calibrated=75,820 | |||
| 100% | 99.5% | 75,820 | 75,426 |
| 90% | 90.9% | 68,238 | 68,923 |
| 80% | 80.9% | 60,656 | 61,363 |
| 70% | 69.2% | 53,074 | 52,480 |
| 60% | 58.4% | 45,492 | 44,281 |
| 50% | 50.1% | 37,910 | 38,003 |
| 40% | 40.0% | 30,328 | 30,303 |
| 30% | 30.1% | 22,746 | 22,814 |
| 20% | 19.8% | 15,164 | 15,004 |
| 10% | 9.6% | 7,582 | 7,283 |
| Active Idle | 0 | 0 | |
| Target Load | Actual Load | ssj_ops | |
|---|---|---|---|
| Target | Actual | ||
| Calibration 1 | 72,849 | ||
| Calibration 2 | 74,561 | ||
| Calibration 3 | 75,470 | ||
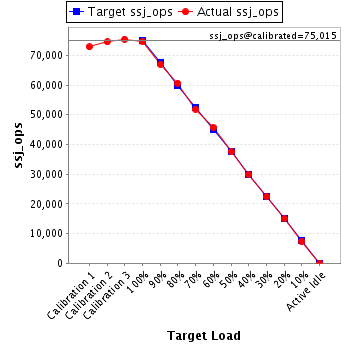
| ssj_ops@calibrated=75,015 | |||
| 100% | 99.7% | 75,015 | 74,767 |
| 90% | 89.3% | 67,514 | 66,993 |
| 80% | 80.9% | 60,012 | 60,661 |
| 70% | 69.2% | 52,511 | 51,894 |
| 60% | 60.9% | 45,009 | 45,698 |
| 50% | 50.0% | 37,508 | 37,504 |
| 40% | 39.8% | 30,006 | 29,880 |
| 30% | 29.8% | 22,505 | 22,371 |
| 20% | 19.9% | 15,003 | 14,917 |
| 10% | 9.8% | 7,502 | 7,364 |
| Active Idle | 0 | 0 | |
| Target Load | Actual Load | ssj_ops | |
|---|---|---|---|
| Target | Actual | ||
| Calibration 1 | 73,380 | ||
| Calibration 2 | 75,069 | ||
| Calibration 3 | 75,341 | ||
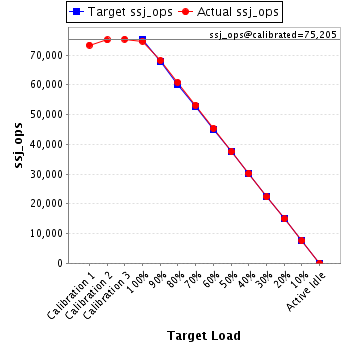
| ssj_ops@calibrated=75,205 | |||
| 100% | 99.3% | 75,205 | 74,700 |
| 90% | 90.6% | 67,685 | 68,149 |
| 80% | 80.9% | 60,164 | 60,808 |
| 70% | 70.7% | 52,644 | 53,186 |
| 60% | 60.3% | 45,123 | 45,335 |
| 50% | 49.9% | 37,603 | 37,525 |
| 40% | 40.2% | 30,082 | 30,213 |
| 30% | 29.6% | 22,562 | 22,281 |
| 20% | 19.8% | 15,041 | 14,921 |
| 10% | 10.1% | 7,521 | 7,583 |
| Active Idle | 0 | 0 | |
| Target Load | Actual Load | ssj_ops | |
|---|---|---|---|
| Target | Actual | ||
| Calibration 1 | 73,534 | ||
| Calibration 2 | 74,029 | ||
| Calibration 3 | 74,981 | ||
| ssj_ops@calibrated=74,505 | |||
| 100% | 100.5% | 74,505 | 74,861 |
| 90% | 89.4% | 67,054 | 66,601 |
| 80% | 81.1% | 59,604 | 60,438 |
| 70% | 69.4% | 52,153 | 51,726 |
| 60% | 60.6% | 44,703 | 45,116 |
| 50% | 50.5% | 37,252 | 37,650 |
| 40% | 39.4% | 29,802 | 29,392 |
| 30% | 29.9% | 22,351 | 22,289 |
| 20% | 20.1% | 14,901 | 15,003 |
| 10% | 9.8% | 7,450 | 7,287 |
| Active Idle | 0 | 0 | |

| Target Load | Actual Load | ssj_ops | |
|---|---|---|---|
| Target | Actual | ||
| Calibration 1 | 74,561 | ||
| Calibration 2 | 75,890 | ||
| Calibration 3 | 76,061 | ||
| ssj_ops@calibrated=75,976 | |||
| 100% | 99.8% | 75,976 | 75,833 |
| 90% | 89.4% | 68,378 | 67,946 |
| 80% | 81.2% | 60,780 | 61,656 |
| 70% | 70.5% | 53,183 | 53,560 |
| 60% | 59.1% | 45,585 | 44,892 |
| 50% | 49.1% | 37,988 | 37,292 |
| 40% | 40.2% | 30,390 | 30,550 |
| 30% | 29.5% | 22,793 | 22,416 |
| 20% | 19.9% | 15,195 | 15,106 |
| 10% | 10.1% | 7,598 | 7,679 |
| Active Idle | 0 | 0 | |

| Target Load | Actual Load | ssj_ops | |
|---|---|---|---|
| Target | Actual | ||
| Calibration 1 | 73,650 | ||
| Calibration 2 | 74,993 | ||
| Calibration 3 | 75,258 | ||
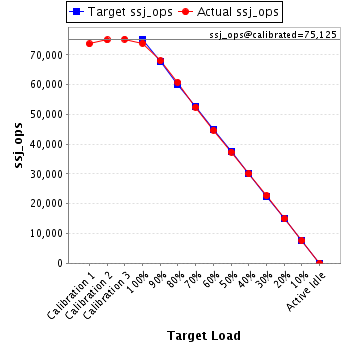
| ssj_ops@calibrated=75,125 | |||
| 100% | 98.4% | 75,125 | 73,901 |
| 90% | 90.5% | 67,613 | 67,961 |
| 80% | 80.9% | 60,100 | 60,745 |
| 70% | 69.8% | 52,588 | 52,473 |
| 60% | 59.5% | 45,075 | 44,701 |
| 50% | 49.7% | 37,563 | 37,345 |
| 40% | 40.0% | 30,050 | 30,020 |
| 30% | 30.2% | 22,538 | 22,668 |
| 20% | 19.9% | 15,025 | 14,941 |
| 10% | 10.1% | 7,513 | 7,608 |
| Active Idle | 0 | 0 | |
| Target Load | Actual Load | ssj_ops | |
|---|---|---|---|
| Target | Actual | ||
| Calibration 1 | 73,930 | ||
| Calibration 2 | 75,044 | ||
| Calibration 3 | 75,294 | ||
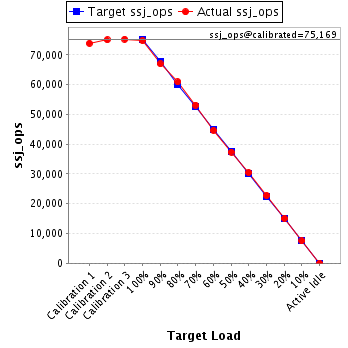
| ssj_ops@calibrated=75,169 | |||
| 100% | 99.5% | 75,169 | 74,806 |
| 90% | 89.1% | 67,652 | 66,993 |
| 80% | 81.0% | 60,135 | 60,919 |
| 70% | 70.7% | 52,618 | 53,162 |
| 60% | 59.5% | 45,101 | 44,703 |
| 50% | 49.7% | 37,585 | 37,382 |
| 40% | 40.5% | 30,068 | 30,454 |
| 30% | 30.3% | 22,551 | 22,776 |
| 20% | 20.0% | 15,034 | 15,068 |
| 10% | 10.0% | 7,517 | 7,504 |
| Active Idle | 0 | 0 | |
| Target Load | Actual Load | ssj_ops | |
|---|---|---|---|
| Target | Actual | ||
| Calibration 1 | 74,195 | ||
| Calibration 2 | 75,377 | ||
| Calibration 3 | 75,576 | ||
| ssj_ops@calibrated=75,477 | |||
| 100% | 99.3% | 75,477 | 74,920 |
| 90% | 90.1% | 67,929 | 67,990 |
| 80% | 79.4% | 60,381 | 59,906 |
| 70% | 69.8% | 52,834 | 52,691 |
| 60% | 59.8% | 45,286 | 45,109 |
| 50% | 49.3% | 37,738 | 37,185 |
| 40% | 39.9% | 30,191 | 30,083 |
| 30% | 30.6% | 22,643 | 23,081 |
| 20% | 19.5% | 15,095 | 14,727 |
| 10% | 9.8% | 7,548 | 7,406 |
| Active Idle | 0 | 0 | |
