SPECpower_ssj2008
Host 'ramsey3' Performance Report
Copyright © 2007-2012 Standard Performance Evaluation Corporation
| SGI Rackable C2112-4G10 | ssj_ops@100% = 1,185,008 ssj_ops@100% per JVM = 74,063 |
||||
| Test Sponsor: | SGI | SPEC License #: | 4 | Test Method: | Multi Node |
| Tested By: | SGI | Test Location: | Fremont, CA, USA | Test Date: | Feb 25, 2012 |
| Hardware Availability: | Apr-2012 | Software Availability: | Apr-2012 | Publication: | Mar 21, 2012 |
| System Source: | Single Supplier | System Designation: | Server | Power Provisioning: | Line-powered |
| Target Load | Actual Load | ssj_ops | |
|---|---|---|---|
| Target | Actual | ||
| Calibration 1 | 1,162,533 | ||
| Calibration 2 | 1,190,630 | ||
| Calibration 3 | 1,194,390 | ||
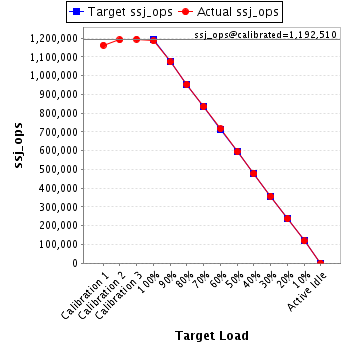
| ssj_ops@calibrated=1,192,510 | |||
| 100% | 99.4% | 1,192,510 | 1,185,008 |
| 90% | 90.0% | 1,073,259 | 1,073,428 |
| 80% | 79.9% | 954,008 | 953,048 |
| 70% | 70.0% | 834,757 | 835,068 |
| 60% | 60.1% | 715,506 | 716,180 |
| 50% | 49.8% | 596,255 | 594,182 |
| 40% | 40.0% | 477,004 | 477,328 |
| 30% | 30.0% | 357,753 | 357,956 |
| 20% | 19.9% | 238,502 | 237,403 |
| 10% | 10.0% | 119,251 | 118,839 |
| Active Idle | 0 | 0 | |
| Set Identifier: | sut |
| Set Description: | Rackable C2112-4G10 |
| # of Identical Nodes: | 4 |
| Comment: | None |
| Hardware | |
|---|---|
| Hardware Vendor: | SGI |
| Model: | Rackable C2112-4G10 |
| Form Factor: | Blade |
| CPU Name: | AMD Opteron 6276 |
| CPU Characteristics: | 16 cores, 2.30 GHz (AMD Turbo CORE technology upto 3.20 GHz) |
| CPU Frequency (MHz): | 2300 |
| CPU(s) Enabled: | 32 cores, 2 chips, 16 cores/chip |
| Hardware Threads: | 32 (1 / core) |
| CPU(s) Orderable: | 1,2 chips |
| Primary Cache: | 512 KB I + 256 KB D on chip per chip |
| Secondary Cache: | 16 MB I+D on chip per chip, 2 MB shared / 2 cores |
| Tertiary Cache: | 16 MB I+D on chip per chip, 8 MB shared / 8 cores |
| Other Cache: | None |
| Memory Amount (GB): | 32 |
| # and size of DIMM: | 8 x 4096 MB |
| Memory Details: | 4 GB 2Rx8 PC3L-10600R; slots 1A, 2A, 3A, and 4A populated for each processor |
| Power Supply Quantity and Rating (W): | None |
| Power Supply Details: | Shared |
| Disk Drive: | 1 x 120 GB 2.5" SSD SATA (SGI PN LSX-SSD25-120G-I) |
| Disk Controller: | Integrated SATA controller |
| # and type of Network Interface Cards (NICs) Installed: | 2 x Integrated Intel 82576 Gigabit Ethernet |
| NICs Enabled in Firmware / OS / Connected: | 2/2/1 |
| Network Speed (Mbit): | 1000 |
| Keyboard: | None |
| Mouse: | None |
| Monitor: | None |
| Optical Drives: | No |
| Other Hardware: | None |
| Software | |
|---|---|
| Power Management: | Power Saver Enabled in OS |
| Operating System (OS): | Microsoft Windows Server 2008 Datacenter Edition |
| OS Version: | R2 |
| Filesystem: | NTFS |
| JVM Vendor: | IBM Corporation |
| JVM Version: | IBM J9 VM (build 2.4, JRE 1.6.0 IBM J9 2.4 Windows Server 2008 amd64-64 jvmwa6460sr7-20091214_49398 (JIT enabled, AOT enabled) |
| JVM Command-line Options: | -Xmn1400m -Xms1600m -Xmx1600m -Xaggressive -Xcompressedrefs -Xgcpolicy:gencon -XlockReservation -Xnoloa -Xlp |
| JVM Affinity: | start /affinity [0x3,0xC,0x30,0xc0,0x300,0xC00,0x3000,0xC000,0x30000,0xC0000,0x300000,0xC00000,0x3000000,0xC000000,0x30000000,0xC0000000] |
| JVM Instances: | 16 |
| JVM Initial Heap (MB): | 1600 |
| JVM Maximum Heap (MB): | 1600 |
| JVM Address Bits: | 64 |
| Boot Firmware Version: | 2.0 dt 10/03/11 |
| Management Firmware Version: | none |
| Workload Version: | SSJ 1.2.9 |
| Director Location: | Controller |
| Other Software: | IBM Websphere Application Server Community Edition V2.1.1.4 for windows on X86-64bit |
| JVM Instance | ssj_ops@100% |
|---|---|
| ramsey3.001 | 73,928 |
| ramsey3.002 | 74,563 |
| ramsey3.003 | 74,210 |
| ramsey3.004 | 74,581 |
| ramsey3.005 | 75,824 |
| ramsey3.006 | 75,031 |
| ramsey3.007 | 73,247 |
| ramsey3.008 | 73,148 |
| ramsey3.009 | 74,039 |
| ramsey3.010 | 73,651 |
| ramsey3.011 | 73,305 |
| ramsey3.012 | 73,254 |
| ramsey3.013 | 73,683 |
| ramsey3.014 | 75,051 |
| ramsey3.015 | 74,319 |
| ramsey3.016 | 73,175 |
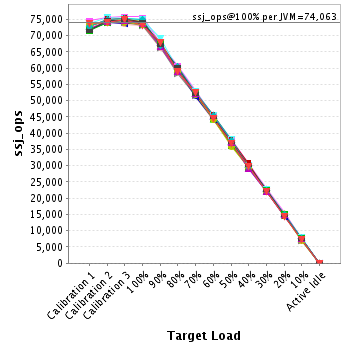
| ssj_ops@100% | 1,185,008 |
| ssj_ops@100% per JVM | 74,063 |
| Target Load | Actual Load | ssj_ops | |
|---|---|---|---|
| Target | Actual | ||
| Calibration 1 | 72,010 | ||
| Calibration 2 | 74,664 | ||
| Calibration 3 | 74,684 | ||
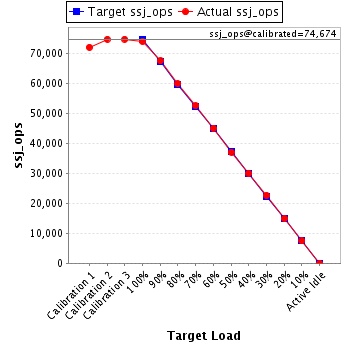
| ssj_ops@calibrated=74,674 | |||
| 100% | 99.0% | 74,674 | 73,928 |
| 90% | 90.3% | 67,206 | 67,440 |
| 80% | 80.2% | 59,739 | 59,875 |
| 70% | 70.3% | 52,272 | 52,487 |
| 60% | 60.3% | 44,804 | 45,018 |
| 50% | 49.6% | 37,337 | 37,064 |
| 40% | 40.2% | 29,869 | 30,047 |
| 30% | 30.4% | 22,402 | 22,665 |
| 20% | 19.9% | 14,935 | 14,858 |
| 10% | 9.9% | 7,467 | 7,425 |
| Active Idle | 0 | 0 | |
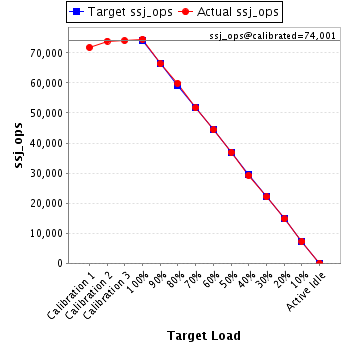
| Target Load | Actual Load | ssj_ops | |
|---|---|---|---|
| Target | Actual | ||
| Calibration 1 | 71,809 | ||
| Calibration 2 | 73,903 | ||
| Calibration 3 | 74,098 | ||
| ssj_ops@calibrated=74,001 | |||
| 100% | 100.8% | 74,001 | 74,563 |
| 90% | 89.6% | 66,601 | 66,328 |
| 80% | 80.9% | 59,200 | 59,871 |
| 70% | 69.9% | 51,800 | 51,721 |
| 60% | 60.0% | 44,400 | 44,382 |
| 50% | 49.9% | 37,000 | 36,918 |
| 40% | 39.5% | 29,600 | 29,195 |
| 30% | 29.8% | 22,200 | 22,068 |
| 20% | 19.9% | 14,800 | 14,741 |
| 10% | 9.8% | 7,400 | 7,250 |
| Active Idle | 0 | 0 | |
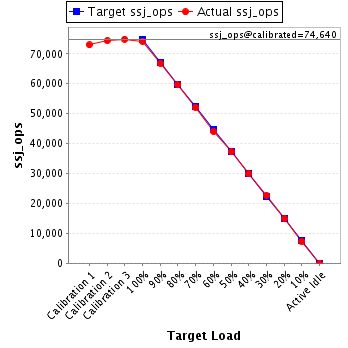
| Target Load | Actual Load | ssj_ops | |
|---|---|---|---|
| Target | Actual | ||
| Calibration 1 | 72,974 | ||
| Calibration 2 | 74,368 | ||
| Calibration 3 | 74,911 | ||
| ssj_ops@calibrated=74,640 | |||
| 100% | 99.4% | 74,640 | 74,210 |
| 90% | 89.7% | 67,176 | 66,920 |
| 80% | 79.9% | 59,712 | 59,638 |
| 70% | 69.9% | 52,248 | 52,141 |
| 60% | 59.1% | 44,784 | 44,103 |
| 50% | 49.8% | 37,320 | 37,201 |
| 40% | 40.0% | 29,856 | 29,872 |
| 30% | 30.4% | 22,392 | 22,677 |
| 20% | 20.0% | 14,928 | 14,913 |
| 10% | 9.8% | 7,464 | 7,303 |
| Active Idle | 0 | 0 | |
| Target Load | Actual Load | ssj_ops | |
|---|---|---|---|
| Target | Actual | ||
| Calibration 1 | 72,420 | ||
| Calibration 2 | 74,166 | ||
| Calibration 3 | 75,356 | ||
| ssj_ops@calibrated=74,761 | |||
| 100% | 99.8% | 74,761 | 74,581 |
| 90% | 89.3% | 67,285 | 66,737 |
| 80% | 80.5% | 59,809 | 60,155 |
| 70% | 70.2% | 52,333 | 52,446 |
| 60% | 61.0% | 44,856 | 45,571 |
| 50% | 50.4% | 37,380 | 37,645 |
| 40% | 40.3% | 29,904 | 30,105 |
| 30% | 29.4% | 22,428 | 21,946 |
| 20% | 20.4% | 14,952 | 15,248 |
| 10% | 10.1% | 7,476 | 7,569 |
| Active Idle | 0 | 0 | |

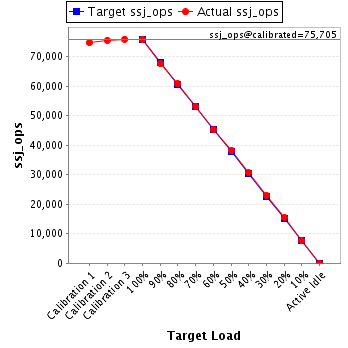
| Target Load | Actual Load | ssj_ops | |
|---|---|---|---|
| Target | Actual | ||
| Calibration 1 | 74,673 | ||
| Calibration 2 | 75,504 | ||
| Calibration 3 | 75,907 | ||
| ssj_ops@calibrated=75,705 | |||
| 100% | 100.2% | 75,705 | 75,824 |
| 90% | 89.3% | 68,135 | 67,577 |
| 80% | 80.4% | 60,564 | 60,886 |
| 70% | 70.1% | 52,994 | 53,102 |
| 60% | 59.7% | 45,423 | 45,206 |
| 50% | 50.5% | 37,853 | 38,200 |
| 40% | 40.4% | 30,282 | 30,621 |
| 30% | 30.3% | 22,712 | 22,967 |
| 20% | 20.4% | 15,141 | 15,466 |
| 10% | 10.1% | 7,571 | 7,654 |
| Active Idle | 0 | 0 | |
| Target Load | Actual Load | ssj_ops | |
|---|---|---|---|
| Target | Actual | ||
| Calibration 1 | 73,609 | ||
| Calibration 2 | 75,416 | ||
| Calibration 3 | 75,344 | ||
| ssj_ops@calibrated=75,380 | |||
| 100% | 99.5% | 75,380 | 75,031 |
| 90% | 91.6% | 67,842 | 69,013 |
| 80% | 79.5% | 60,304 | 59,955 |
| 70% | 70.2% | 52,766 | 52,893 |
| 60% | 60.1% | 45,228 | 45,334 |
| 50% | 50.4% | 37,690 | 37,990 |
| 40% | 40.0% | 30,152 | 30,180 |
| 30% | 30.1% | 22,614 | 22,672 |
| 20% | 19.9% | 15,076 | 14,989 |
| 10% | 10.4% | 7,538 | 7,846 |
| Active Idle | 0 | 0 | |

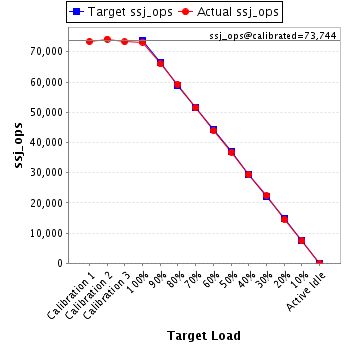
| Target Load | Actual Load | ssj_ops | |
|---|---|---|---|
| Target | Actual | ||
| Calibration 1 | 73,386 | ||
| Calibration 2 | 74,187 | ||
| Calibration 3 | 73,301 | ||
| ssj_ops@calibrated=73,744 | |||
| 100% | 99.3% | 73,744 | 73,247 |
| 90% | 89.5% | 66,369 | 66,002 |
| 80% | 80.3% | 58,995 | 59,188 |
| 70% | 69.7% | 51,621 | 51,419 |
| 60% | 59.5% | 44,246 | 43,891 |
| 50% | 49.9% | 36,872 | 36,810 |
| 40% | 39.8% | 29,497 | 29,371 |
| 30% | 30.3% | 22,123 | 22,360 |
| 20% | 19.7% | 14,749 | 14,512 |
| 10% | 10.0% | 7,374 | 7,383 |
| Active Idle | 0 | 0 | |
| Target Load | Actual Load | ssj_ops | |
|---|---|---|---|
| Target | Actual | ||
| Calibration 1 | 71,746 | ||
| Calibration 2 | 73,909 | ||
| Calibration 3 | 73,961 | ||
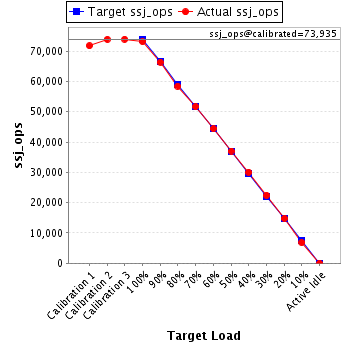
| ssj_ops@calibrated=73,935 | |||
| 100% | 98.9% | 73,935 | 73,148 |
| 90% | 89.8% | 66,542 | 66,391 |
| 80% | 79.1% | 59,148 | 58,473 |
| 70% | 69.9% | 51,755 | 51,689 |
| 60% | 60.1% | 44,361 | 44,404 |
| 50% | 50.1% | 36,968 | 37,042 |
| 40% | 40.7% | 29,574 | 30,067 |
| 30% | 30.3% | 22,181 | 22,429 |
| 20% | 20.0% | 14,787 | 14,796 |
| 10% | 9.3% | 7,394 | 6,871 |
| Active Idle | 0 | 0 | |
| Target Load | Actual Load | ssj_ops | |
|---|---|---|---|
| Target | Actual | ||
| Calibration 1 | 72,730 | ||
| Calibration 2 | 74,864 | ||
| Calibration 3 | 75,135 | ||
| ssj_ops@calibrated=75,000 | |||
| 100% | 98.7% | 75,000 | 74,039 |
| 90% | 89.3% | 67,500 | 66,980 |
| 80% | 78.6% | 60,000 | 58,916 |
| 70% | 70.2% | 52,500 | 52,643 |
| 60% | 60.5% | 45,000 | 45,393 |
| 50% | 50.2% | 37,500 | 37,628 |
| 40% | 40.8% | 30,000 | 30,621 |
| 30% | 29.5% | 22,500 | 22,123 |
| 20% | 19.7% | 15,000 | 14,812 |
| 10% | 10.2% | 7,500 | 7,683 |
| Active Idle | 0 | 0 | |

| Target Load | Actual Load | ssj_ops | |
|---|---|---|---|
| Target | Actual | ||
| Calibration 1 | 71,801 | ||
| Calibration 2 | 73,931 | ||
| Calibration 3 | 73,682 | ||
| ssj_ops@calibrated=73,806 | |||
| 100% | 99.8% | 73,806 | 73,651 |
| 90% | 90.5% | 66,426 | 66,822 |
| 80% | 80.6% | 59,045 | 59,456 |
| 70% | 69.5% | 51,664 | 51,330 |
| 60% | 60.0% | 44,284 | 44,306 |
| 50% | 49.3% | 36,903 | 36,372 |
| 40% | 39.9% | 29,522 | 29,481 |
| 30% | 30.1% | 22,142 | 22,184 |
| 20% | 19.3% | 14,761 | 14,266 |
| 10% | 10.2% | 7,381 | 7,536 |
| Active Idle | 0 | 0 | |

| Target Load | Actual Load | ssj_ops | |
|---|---|---|---|
| Target | Actual | ||
| Calibration 1 | 71,522 | ||
| Calibration 2 | 73,944 | ||
| Calibration 3 | 74,559 | ||
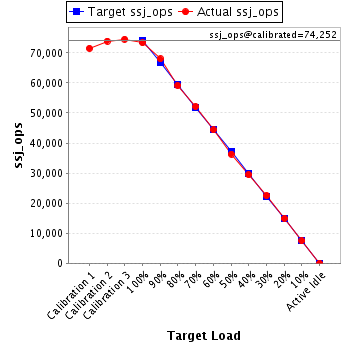
| ssj_ops@calibrated=74,252 | |||
| 100% | 98.7% | 74,252 | 73,305 |
| 90% | 91.6% | 66,826 | 67,982 |
| 80% | 79.6% | 59,401 | 59,137 |
| 70% | 70.2% | 51,976 | 52,148 |
| 60% | 59.8% | 44,551 | 44,369 |
| 50% | 48.9% | 37,126 | 36,341 |
| 40% | 39.6% | 29,701 | 29,434 |
| 30% | 30.3% | 22,275 | 22,500 |
| 20% | 20.1% | 14,850 | 14,949 |
| 10% | 10.1% | 7,425 | 7,473 |
| Active Idle | 0 | 0 | |
| Target Load | Actual Load | ssj_ops | |
|---|---|---|---|
| Target | Actual | ||
| Calibration 1 | 73,416 | ||
| Calibration 2 | 73,951 | ||
| Calibration 3 | 74,085 | ||
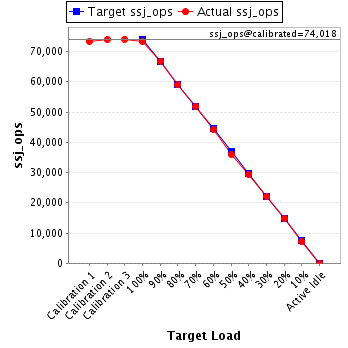
| ssj_ops@calibrated=74,018 | |||
| 100% | 99.0% | 74,018 | 73,254 |
| 90% | 90.2% | 66,616 | 66,800 |
| 80% | 79.6% | 59,214 | 58,942 |
| 70% | 70.1% | 51,813 | 51,864 |
| 60% | 59.7% | 44,411 | 44,168 |
| 50% | 48.6% | 37,009 | 35,968 |
| 40% | 39.7% | 29,607 | 29,414 |
| 30% | 29.8% | 22,205 | 22,086 |
| 20% | 19.9% | 14,804 | 14,712 |
| 10% | 9.6% | 7,402 | 7,114 |
| Active Idle | 0 | 0 | |
| Target Load | Actual Load | ssj_ops | |
|---|---|---|---|
| Target | Actual | ||
| Calibration 1 | 72,316 | ||
| Calibration 2 | 74,378 | ||
| Calibration 3 | 74,543 | ||
| ssj_ops@calibrated=74,461 | |||
| 100% | 99.0% | 74,461 | 73,683 |
| 90% | 89.3% | 67,015 | 66,517 |
| 80% | 79.2% | 59,568 | 58,942 |
| 70% | 70.0% | 52,122 | 52,120 |
| 60% | 60.9% | 44,676 | 45,328 |
| 50% | 49.9% | 37,230 | 37,140 |
| 40% | 39.2% | 29,784 | 29,213 |
| 30% | 29.5% | 22,338 | 21,970 |
| 20% | 20.2% | 14,892 | 15,007 |
| 10% | 10.2% | 7,446 | 7,591 |
| Active Idle | 0 | 0 | |

| Target Load | Actual Load | ssj_ops | |
|---|---|---|---|
| Target | Actual | ||
| Calibration 1 | 72,901 | ||
| Calibration 2 | 74,804 | ||
| Calibration 3 | 75,238 | ||
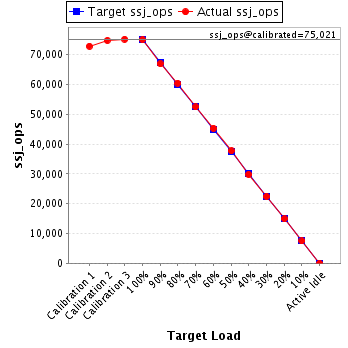
| ssj_ops@calibrated=75,021 | |||
| 100% | 100.0% | 75,021 | 75,051 |
| 90% | 89.2% | 67,519 | 66,954 |
| 80% | 80.6% | 60,017 | 60,469 |
| 70% | 69.9% | 52,515 | 52,467 |
| 60% | 60.4% | 45,013 | 45,344 |
| 50% | 50.3% | 37,511 | 37,723 |
| 40% | 39.8% | 30,008 | 29,841 |
| 30% | 29.9% | 22,506 | 22,447 |
| 20% | 19.9% | 15,004 | 14,909 |
| 10% | 10.0% | 7,502 | 7,487 |
| Active Idle | 0 | 0 | |
| Target Load | Actual Load | ssj_ops | |
|---|---|---|---|
| Target | Actual | ||
| Calibration 1 | 71,518 | ||
| Calibration 2 | 74,651 | ||
| Calibration 3 | 74,778 | ||
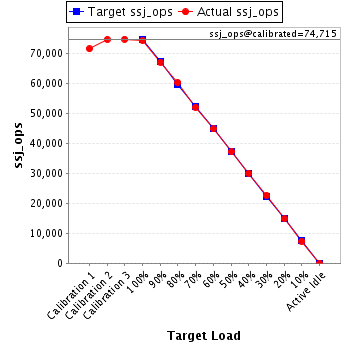
| ssj_ops@calibrated=74,715 | |||
| 100% | 99.5% | 74,715 | 74,319 |
| 90% | 89.8% | 67,243 | 67,127 |
| 80% | 80.7% | 59,772 | 60,304 |
| 70% | 69.7% | 52,300 | 52,093 |
| 60% | 60.0% | 44,829 | 44,814 |
| 50% | 49.8% | 37,357 | 37,179 |
| 40% | 40.2% | 29,886 | 30,062 |
| 30% | 30.3% | 22,414 | 22,655 |
| 20% | 19.8% | 14,943 | 14,775 |
| 10% | 9.8% | 7,471 | 7,356 |
| Active Idle | 0 | 0 | |
| Target Load | Actual Load | ssj_ops | |
|---|---|---|---|
| Target | Actual | ||
| Calibration 1 | 73,703 | ||
| Calibration 2 | 73,991 | ||
| Calibration 3 | 74,808 | ||
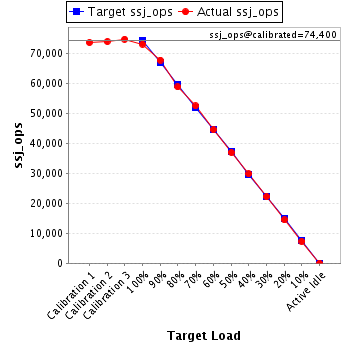
| ssj_ops@calibrated=74,400 | |||
| 100% | 98.4% | 74,400 | 73,175 |
| 90% | 91.2% | 66,960 | 67,838 |
| 80% | 79.1% | 59,520 | 58,842 |
| 70% | 70.6% | 52,080 | 52,508 |
| 60% | 59.9% | 44,640 | 44,552 |
| 50% | 49.7% | 37,200 | 36,960 |
| 40% | 40.1% | 29,760 | 29,804 |
| 30% | 29.9% | 22,320 | 22,209 |
| 20% | 19.4% | 14,880 | 14,451 |
| 10% | 9.8% | 7,440 | 7,298 |
| Active Idle | 0 | 0 | |