SPECpower_ssj2008
Aggregate Performance Report
Copyright © 2007-2012 Standard Performance Evaluation Corporation
| Huawei Technologies Co., Ltd XH320 V2 | ssj_ops@100% = 5,289,221 ssj_ops@100% per Host = 1,322,305 ssj_ops@100% per JVM = 165,288 |
||||
| Test Sponsor: | Huawei Technologies Co., Ltd | SPEC License #: | 3175 | Test Method: | Multi Node |
| Tested By: | Huawei Technologies Co., Ltd | Test Location: | Shenzhen, Guangdong, China | Test Date: | Jun 4, 2012 |
| Hardware Availability: | May-2012 | Software Availability: | Dec-2011 | Publication: | Jun 28, 2012 |
| System Source: | Single Supplier | System Designation: | Server | Power Provisioning: | Line-powered |
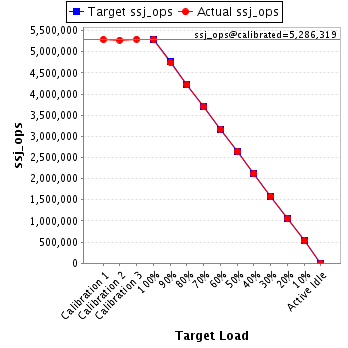
| Target Load | Actual Load | ssj_ops | |
|---|---|---|---|
| Target | Actual | ||
| Calibration 1 | 5,285,109 | ||
| Calibration 2 | 5,275,510 | ||
| Calibration 3 | 5,297,128 | ||
| ssj_ops@calibrated=5,286,319 | |||
| 100% | 100.1% | 5,286,319 | 5,289,221 |
| 90% | 89.7% | 4,757,687 | 4,742,831 |
| 80% | 79.8% | 4,229,055 | 4,220,470 |
| 70% | 69.9% | 3,700,423 | 3,695,691 |
| 60% | 60.0% | 3,171,791 | 3,170,468 |
| 50% | 50.1% | 2,643,159 | 2,648,275 |
| 40% | 40.0% | 2,114,528 | 2,114,016 |
| 30% | 30.0% | 1,585,896 | 1,584,868 |
| 20% | 19.9% | 1,057,264 | 1,053,908 |
| 10% | 10.0% | 528,632 | 530,531 |
| Active Idle | 0 | 0 | |
| # of Nodes | # of Chips | # of Cores | # of Threads | Total RAM (GB) | # of OS Images | # of JVM Instances |
|---|---|---|---|---|---|---|
| 4 | 8 | 64 | 128 | 64.0 | 4 | 32 |
| Set Identifier: | sut |
| Set Description: | System Under Test |
| # of Identical Nodes: | 4 |
| Comment: | None |
| Hardware per Node | |
|---|---|
| Hardware Vendor: | Huawei Technologies Co., Ltd |
| Model: | XH320 V2 |
| Form Factor: | 1U |
| CPU Name: | Intel Xeon E5-2470 |
| CPU Characteristics: | 8-Core, 2.30 GHz, 20 MB L3 Cache (Turbo Boost Technology up to 3.1 GHz) |
| CPU Frequency (MHz): | 2300 |
| CPU(s) Enabled: | 16 cores, 2 chips, 8 cores/chip |
| Hardware Threads: | 32 (2 / core) |
| CPU(s) Orderable: | 1,2 chips |
| Primary Cache: | 32 KB I + 32 KB D on chip per core |
| Secondary Cache: | 256 KB I+D on chip per core |
| Tertiary Cache: | 20 MB I+D on chip per chip |
| Other Cache: | None |
| Memory Amount (GB): | 16 |
| # and size of DIMM: | 4 x 4 GB |
| Memory Details: | 4GB 2Rx8 PC3L-10600R ECC |
| Power Supply Quantity and Rating (W): | None |
| Power Supply Details: | Shared |
| Disk Drive: | 1 x 160GB SSD 2.5" SATA, Huawei P/N 02310KSX |
| Disk Controller: | Integrated SATA controller |
| # and type of Network Interface Cards (NICs) Installed: | 1 x Dual-port Intel 82580 Gigabit Ethernet controller |
| NICs Enabled in Firmware / OS / Connected: | 2/2/1 |
| Network Speed (Mbit): | 1000 |
| Keyboard: | None |
| Mouse: | None |
| Monitor: | None |
| Optical Drives: | No |
| Other Hardware: | None |
| Software per Node | |
|---|---|
| Power Management: | Power Saver enabled in OS |
| Operating System (OS): | Microsoft Windows Server 2008 Enterprise x64 Edition |
| OS Version: | R2 SP1 |
| Filesystem: | NTFS |
| JVM Vendor: | Oracle Corporation |
| JVM Version: | Oracle Java HotSpot(TM) 64-Bit Server VM on Windows, version 1.6.0_30 |
| JVM Command-line Options: | -server -Xmx1600m -Xms1600m -Xmn1200m -XX:ParallelGCThreads=2 -XX:SurvivorRatio=60 -XX:TargetSurvivorRatio=90 -XX:InlineSmallCode=3900 -XX:MaxInlineSize=270 -XX:FreqInlineSize=2500 -XX:AllocatePrefetchDistance=256 -XX:AllocatePrefetchLines=4 -XX:InitialTenuringThreshold=12 -XX:MaxTenuringThreshold=15 -XX:LoopUnrollLimit=45 -XX:+UseCompressedStrings -XX:+AggressiveOpts -XX:+UseLargePages -XX:+UseParallelOldGC |
| JVM Affinity: | start /affinity [0x0F,0xF0,0xF00,0xF000,0xF0000,0xF00000,0xF000000,0xF0000000] |
| JVM Instances: | 8 |
| JVM Initial Heap (MB): | 1600 |
| JVM Maximum Heap (MB): | 1600 |
| JVM Address Bits: | 64 |
| Boot Firmware Version: | V020 |
| Management Firmware Version: | 3.05 |
| Workload Version: | SSJ 1.2.9 |
| Director Location: | Controller |
| Other Software: | None |
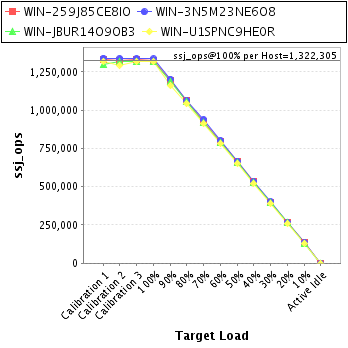
| Host | ssj_ops@100% |
|---|---|
| WIN-259J85CE8IO | 1,325,855 |
| WIN-3N5M23NE6O8 | 1,334,311 |
| WIN-JBUR14O9OB3 | 1,314,616 |
| WIN-U1SPNC9HE0R | 1,314,439 |
| ssj_ops@100% | 5,289,221 |
| ssj_ops@100% per Host | 1,322,305 |
| ssj_ops@100% per JVM | 165,288 |
| Target Load | Actual Load | ssj_ops | |
|---|---|---|---|
| Target | Actual | ||
| Calibration 1 | 1,328,353 | ||
| Calibration 2 | 1,327,436 | ||
| Calibration 3 | 1,327,773 | ||
| ssj_ops@calibrated=1,327,605 | |||
| 100% | 99.9% | 1,327,605 | 1,325,855 |
| 90% | 90.1% | 1,194,844 | 1,196,052 |
| 80% | 79.9% | 1,062,084 | 1,060,242 |
| 70% | 69.9% | 929,323 | 927,765 |
| 60% | 60.1% | 796,563 | 797,919 |
| 50% | 50.1% | 663,802 | 665,793 |
| 40% | 40.0% | 531,042 | 531,305 |
| 30% | 30.0% | 398,281 | 398,886 |
| 20% | 19.8% | 265,521 | 263,161 |
| 10% | 10.1% | 132,760 | 133,594 |
| Active Idle | 0 | 0 | |
| Target Load | Actual Load | ssj_ops | |
|---|---|---|---|
| Target | Actual | ||
| Calibration 1 | 1,339,347 | ||
| Calibration 2 | 1,336,196 | ||
| Calibration 3 | 1,335,540 | ||
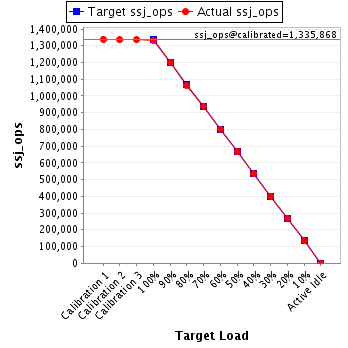
| ssj_ops@calibrated=1,335,868 | |||
| 100% | 99.9% | 1,335,868 | 1,334,311 |
| 90% | 90.0% | 1,202,281 | 1,202,336 |
| 80% | 79.6% | 1,068,694 | 1,063,729 |
| 70% | 70.2% | 935,107 | 938,249 |
| 60% | 60.0% | 801,521 | 801,601 |
| 50% | 50.0% | 667,934 | 667,486 |
| 40% | 40.0% | 534,347 | 534,151 |
| 30% | 30.0% | 400,760 | 400,562 |
| 20% | 20.0% | 267,174 | 267,180 |
| 10% | 10.0% | 133,587 | 133,992 |
| Active Idle | 0 | 0 | |
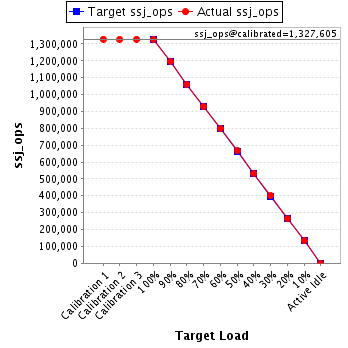
| Target Load | Actual Load | ssj_ops | |
|---|---|---|---|
| Target | Actual | ||
| Calibration 1 | 1,299,250 | ||
| Calibration 2 | 1,318,212 | ||
| Calibration 3 | 1,316,587 | ||
| ssj_ops@calibrated=1,317,400 | |||
| 100% | 99.8% | 1,317,400 | 1,314,616 |
| 90% | 89.9% | 1,185,660 | 1,184,368 |
| 80% | 80.0% | 1,053,920 | 1,053,893 |
| 70% | 69.8% | 922,180 | 918,996 |
| 60% | 59.9% | 790,440 | 789,187 |
| 50% | 50.2% | 658,700 | 660,688 |
| 40% | 40.0% | 526,960 | 526,786 |
| 30% | 30.0% | 395,220 | 394,764 |
| 20% | 20.0% | 263,480 | 263,535 |
| 10% | 10.0% | 131,740 | 131,862 |
| Active Idle | 0 | 0 | |

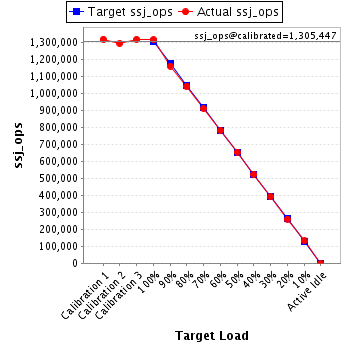
| Target Load | Actual Load | ssj_ops | |
|---|---|---|---|
| Target | Actual | ||
| Calibration 1 | 1,318,159 | ||
| Calibration 2 | 1,293,666 | ||
| Calibration 3 | 1,317,229 | ||
| ssj_ops@calibrated=1,305,447 | |||
| 100% | 100.7% | 1,305,447 | 1,314,439 |
| 90% | 88.9% | 1,174,902 | 1,160,074 |
| 80% | 79.9% | 1,044,358 | 1,042,606 |
| 70% | 69.8% | 913,813 | 910,681 |
| 60% | 59.9% | 783,268 | 781,762 |
| 50% | 50.1% | 652,724 | 654,308 |
| 40% | 40.0% | 522,179 | 521,774 |
| 30% | 29.9% | 391,634 | 390,656 |
| 20% | 19.9% | 261,089 | 260,032 |
| 10% | 10.0% | 130,545 | 131,083 |
| Active Idle | 0 | 0 | |