
SPECpower_ssj2008
Aggregate Performance Report
Copyright © 2007-2012 Standard Performance Evaluation Corporation
| Acer Incorporated Acer AW2000h-AW170h F2 | ssj_ops@100% = 5,286,503 ssj_ops@100% per Host = 1,321,626 ssj_ops@100% per JVM = 165,203 |
||||
| Test Sponsor: | Acer Incorporated | SPEC License #: | 97 | Test Method: | Multi Node |
| Tested By: | Acer Incorporated | Test Location: | Taipei, R.O.C. | Test Date: | Sep 12, 2012 |
| Hardware Availability: | Sep-2012 | Software Availability: | Aug-2012 | Publication: | Oct 3, 2012 |
| System Source: | Single Supplier | System Designation: | Server | Power Provisioning: | Line-powered |
| Target Load | Actual Load | ssj_ops | |
|---|---|---|---|
| Target | Actual | ||
| Calibration 1 | 5,270,071 | ||
| Calibration 2 | 5,305,092 | ||
| Calibration 3 | 5,299,764 | ||
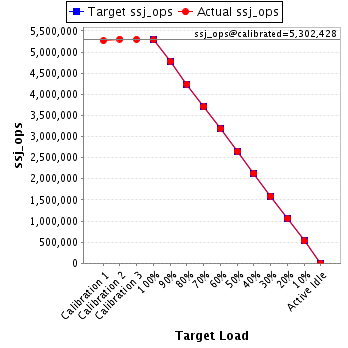
| ssj_ops@calibrated=5,302,428 | |||
| 100% | 99.7% | 5,302,428 | 5,286,503 |
| 90% | 90.1% | 4,772,185 | 4,778,339 |
| 80% | 80.0% | 4,241,942 | 4,241,596 |
| 70% | 69.9% | 3,711,699 | 3,706,521 |
| 60% | 60.0% | 3,181,457 | 3,182,351 |
| 50% | 50.0% | 2,651,214 | 2,649,354 |
| 40% | 40.0% | 2,120,971 | 2,122,809 |
| 30% | 30.0% | 1,590,728 | 1,590,835 |
| 20% | 20.0% | 1,060,486 | 1,058,864 |
| 10% | 10.0% | 530,243 | 530,368 |
| Active Idle | 0 | 0 | |
| # of Nodes | # of Chips | # of Cores | # of Threads | Total RAM (GB) | # of OS Images | # of JVM Instances |
|---|---|---|---|---|---|---|
| 4 | 8 | 64 | 128 | 128 | 4 | 32 |
| Set Identifier: | sut |
| Set Description: | System Under Test |
| # of Identical Nodes: | 4 |
| Comment: | None |
| Hardware per Node | |
|---|---|
| Hardware Vendor: | Acer Incorporated |
| Model: | Acer AW2000h-AW170h F2 |
| Form Factor: | 2U |
| CPU Name: | Intel Xeon E5-2660 2.2 GHz (Intel Turbo Boost Technology up to 3.00 GHz) |
| CPU Characteristics: | 8 core, 2.2GHz, 20MB L3 Cache |
| CPU Frequency (MHz): | 2200 |
| CPU(s) Enabled: | 16 cores, 2 chips, 8 cores/chip |
| Hardware Threads: | 32 (2 / core) |
| CPU(s) Orderable: | 1,2 chips |
| Primary Cache: | 32 KB I + 32 KB D on chip per core |
| Secondary Cache: | 256 MB I+D on chip per core |
| Tertiary Cache: | 20 MB I+D on chip per chip |
| Other Cache: | None |
| Memory Amount (GB): | 32 |
| # and size of DIMM: | 8 x 4096 MB |
| Memory Details: | 4GB 2Rx8 PC3L-10600R; slots A1, B1, C1, D1, E1, F1, G1 and H1 populated |
| Power Supply Quantity and Rating (W): | None |
| Power Supply Details: | Shared |
| Disk Drive: | 1 x 64GB SATA SSD, Acer P/N KN.06404.002 |
| Disk Controller: | onboard SAS/SATA controller |
| # and type of Network Interface Cards (NICs) Installed: | 1 x Dual-port Intel I350 Gigabit Ethernet controller |
| NICs Enabled in Firmware / OS / Connected: | 2/2/1 |
| Network Speed (Mbit): | 1000 |
| Keyboard: | None |
| Mouse: | None |
| Monitor: | None |
| Optical Drives: | No |
| Other Hardware: | None |
| Software per Node | |
|---|---|
| Power Management: | Power save enabled in OS |
| Operating System (OS): | Windows Server 2008, Enterprise Edition |
| OS Version: | R2 SP1 |
| Filesystem: | NTFS |
| JVM Vendor: | Oracle Corporation |
| JVM Version: | Oracle Java HotSpot(TM) 64-Bit Server VM on Windows, version 1.6.0_35 |
| JVM Command-line Options: | -server -showversion -Xmx2048m -Xms2048m -Xmn1706m -XX:ParallelGCThreads=4 -XX:BiasedLockingStartupDelay=200 -XX:SurvivorRatio=60 -XX:TargetSurvivorRatio=90 -XX:InlineSmallCode=3900 -XX:MaxInlineSize=270 -XX:FreqInlineSize=2500 -XX:AllocatePrefetchDistance=256 -XX:AllocatePrefetchLines=4 -XX:InitialTenuringThreshold=12 -XX:MaxTenuringThreshold=15 -XX:LoopUnrollLimit=45 -XX:+UseCompressedStrings -XX:+AggressiveOpts -XX:+UseLargePages -XX:+UseParallelOldGC -XX:-UseAdaptiveSizePolicy |
| JVM Affinity: | start /affinity [0000000F, 000000F0, 00000F00, 0000F000, 000F0000, 00F00000, 0F000000, F0000000] |
| JVM Instances: | 8 |
| JVM Initial Heap (MB): | 2048 |
| JVM Maximum Heap (MB): | 2048 |
| JVM Address Bits: | 64 |
| Boot Firmware Version: | 01.03.0002 |
| Management Firmware Version: | 01.10.3656 |
| Workload Version: | SSJ 1.2.9 |
| Director Location: | Controller |
| Other Software: | None |
| Host | ssj_ops@100% |
|---|---|
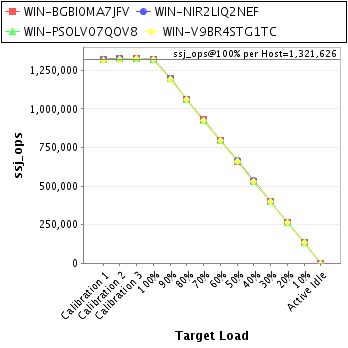
| WIN-BGBI0MA7JFV | 1,321,931 |
| WIN-NIR2LIQ2NEF | 1,320,816 |
| WIN-PSOLV07QOV8 | 1,321,920 |
| WIN-V9BR4STG1TC | 1,321,836 |
| ssj_ops@100% | 5,286,503 |
| ssj_ops@100% per Host | 1,321,626 |
| ssj_ops@100% per JVM | 165,203 |
| Target Load | Actual Load | ssj_ops | |
|---|---|---|---|
| Target | Actual | ||
| Calibration 1 | 1,318,040 | ||
| Calibration 2 | 1,328,185 | ||
| Calibration 3 | 1,325,351 | ||
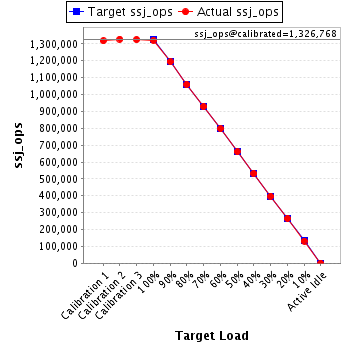
| ssj_ops@calibrated=1,326,768 | |||
| 100% | 99.6% | 1,326,768 | 1,321,931 |
| 90% | 90.0% | 1,194,091 | 1,194,496 |
| 80% | 79.9% | 1,061,414 | 1,059,455 |
| 70% | 70.0% | 928,738 | 929,141 |
| 60% | 60.1% | 796,061 | 796,957 |
| 50% | 49.8% | 663,384 | 660,749 |
| 40% | 40.1% | 530,707 | 531,540 |
| 30% | 30.0% | 398,030 | 397,696 |
| 20% | 20.0% | 265,354 | 265,587 |
| 10% | 9.9% | 132,677 | 131,812 |
| Active Idle | 0 | 0 | |
| Target Load | Actual Load | ssj_ops | |
|---|---|---|---|
| Target | Actual | ||
| Calibration 1 | 1,318,044 | ||
| Calibration 2 | 1,327,307 | ||
| Calibration 3 | 1,324,730 | ||
| ssj_ops@calibrated=1,326,018 | |||
| 100% | 99.6% | 1,326,018 | 1,320,816 |
| 90% | 90.2% | 1,193,417 | 1,195,462 |
| 80% | 80.0% | 1,060,815 | 1,060,476 |
| 70% | 69.8% | 928,213 | 925,445 |
| 60% | 59.9% | 795,611 | 793,809 |
| 50% | 50.0% | 663,009 | 662,914 |
| 40% | 40.2% | 530,407 | 533,055 |
| 30% | 30.1% | 397,806 | 398,595 |
| 20% | 20.0% | 265,204 | 264,689 |
| 10% | 10.0% | 132,602 | 132,259 |
| Active Idle | 0 | 0 | |

| Target Load | Actual Load | ssj_ops | |
|---|---|---|---|
| Target | Actual | ||
| Calibration 1 | 1,319,056 | ||
| Calibration 2 | 1,326,756 | ||
| Calibration 3 | 1,323,515 | ||
| ssj_ops@calibrated=1,325,136 | |||
| 100% | 99.8% | 1,325,136 | 1,321,920 |
| 90% | 90.2% | 1,192,622 | 1,195,492 |
| 80% | 80.0% | 1,060,109 | 1,059,720 |
| 70% | 69.9% | 927,595 | 926,119 |
| 60% | 60.1% | 795,081 | 796,740 |
| 50% | 50.2% | 662,568 | 665,015 |
| 40% | 39.9% | 530,054 | 529,062 |
| 30% | 30.0% | 397,541 | 396,990 |
| 20% | 19.9% | 265,027 | 263,999 |
| 10% | 10.0% | 132,514 | 132,867 |
| Active Idle | 0 | 0 | |

| Target Load | Actual Load | ssj_ops | |
|---|---|---|---|
| Target | Actual | ||
| Calibration 1 | 1,314,931 | ||
| Calibration 2 | 1,322,844 | ||
| Calibration 3 | 1,326,168 | ||
| ssj_ops@calibrated=1,324,506 | |||
| 100% | 99.8% | 1,324,506 | 1,321,836 |
| 90% | 90.1% | 1,192,055 | 1,192,889 |
| 80% | 80.2% | 1,059,605 | 1,061,944 |
| 70% | 69.9% | 927,154 | 925,816 |
| 60% | 60.0% | 794,703 | 794,844 |
| 50% | 49.9% | 662,253 | 660,675 |
| 40% | 40.0% | 529,802 | 529,151 |
| 30% | 30.0% | 397,352 | 397,554 |
| 20% | 20.0% | 264,901 | 264,589 |
| 10% | 10.1% | 132,451 | 133,429 |
| Active Idle | 0 | 0 | |
