
SPECpower_ssj2008
Aggregate Performance Report
Copyright © 2007-2012 Standard Performance Evaluation Corporation
| Dell Inc. PowerEdge M915 (AMD Opteron 6380, 2.50 GHz) | ssj_ops@100% = 25,132,429 ssj_ops@100% per Host = 3,141,554 ssj_ops@100% per JVM = 196,347 |
||||
| Test Sponsor: | Dell Inc. | SPEC License #: | 55 | Test Method: | Multi Node |
| Tested By: | Dell Inc. | Test Location: | Round Rock, TX, USA | Test Date: | Oct 18, 2012 |
| Hardware Availability: | Dec-2012 | Software Availability: | Jun-2012 | Publication: | Nov 14, 2012 |
| System Source: | Single Supplier | System Designation: | Server | Power Provisioning: | Line-powered |
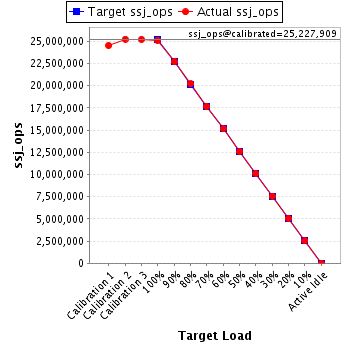
| Target Load | Actual Load | ssj_ops | |
|---|---|---|---|
| Target | Actual | ||
| Calibration 1 | 24,514,156 | ||
| Calibration 2 | 25,234,815 | ||
| Calibration 3 | 25,221,003 | ||
| ssj_ops@calibrated=25,227,909 | |||
| 100% | 99.6% | 25,227,909 | 25,132,429 |
| 90% | 90.0% | 22,705,118 | 22,709,440 |
| 80% | 80.0% | 20,182,327 | 20,188,255 |
| 70% | 70.0% | 17,659,536 | 17,665,968 |
| 60% | 60.0% | 15,136,745 | 15,143,340 |
| 50% | 50.0% | 12,613,955 | 12,605,861 |
| 40% | 40.1% | 10,091,164 | 10,105,199 |
| 30% | 30.0% | 7,568,373 | 7,572,612 |
| 20% | 20.0% | 5,045,582 | 5,044,996 |
| 10% | 10.0% | 2,522,791 | 2,518,962 |
| Active Idle | 0 | 0 | |
| # of Nodes | # of Chips | # of Cores | # of Threads | Total RAM (GB) | # of OS Images | # of JVM Instances |
|---|---|---|---|---|---|---|
| 8 | 32 | 512 | 512 | 512 | 8 | 128 |
| Set Identifier: | sut |
| Set Description: | M915 |
| # of Identical Nodes: | 8 |
| Comment: | None |
| Hardware per Node | |
|---|---|
| Hardware Vendor: | Dell Inc. |
| Model: | PowerEdge M915 (AMD Opteron 6380, 2.50 GHz) |
| Form Factor: | Blade |
| CPU Name: | AMD Opteron 6380 (2.50 GHz) |
| CPU Characteristics: | 16 Core, 2.50 GHz, 16 MB L3 Cache |
| CPU Frequency (MHz): | 2500 |
| CPU(s) Enabled: | 64 cores, 4 chips, 16 cores/chip |
| Hardware Threads: | 64 (1 / core) |
| CPU(s) Orderable: | 2,4 chips |
| Primary Cache: | 512 KB I + 256 KB D on chip per chip |
| Secondary Cache: | 16 MB I+D on chip per chip, 2 MB shared / 2 cores |
| Tertiary Cache: | 16 MB I+D on chip per chip, 8MB shared / 8 cores |
| Other Cache: | None |
| Memory Amount (GB): | 64 |
| # and size of DIMM: | 16 x 4096 MB |
| Memory Details: | 4GB 2Rx8 PC3L-10600E ECC, Slots A1-A4, B1-B4, C1-C4, D1-D4 populated |
| Power Supply Quantity and Rating (W): | None |
| Power Supply Details: | Shared |
| Disk Drive: | 1 x 200 GB 2.5" SSD Dell P/N 6K55X |
| Disk Controller: | PERC H200 Modular |
| # and type of Network Interface Cards (NICs) Installed: | 2 x onboard Broadcom 5709 Dual Port 1GbE NIC Dell P/N: D17W2 |
| NICs Enabled in Firmware / OS / Connected: | 2/2/1 |
| Network Speed (Mbit): | 1000 |
| Keyboard: | None |
| Mouse: | None |
| Monitor: | None |
| Optical Drives: | No |
| Other Hardware: | None |
| Software per Node | |
|---|---|
| Power Management: | Balanced Mode in OS (See Notes) |
| Operating System (OS): | Microsoft Windows 2008 Server Enterprise x64 Edition |
| OS Version: | R2 SP1 |
| Filesystem: | NTFS |
| JVM Vendor: | IBM Corporation |
| JVM Version: | IBM J9 VM (build 2.6, JRE 1.7.0 Windows Server 2008 R2 amd64-64 20120322_106209 (JIT enabled, AOT enabled) |
| JVM Command-line Options: | -Xaggressive -Xcompressedrefs -Xmn1400m -Xms1875m -Xmx1875m -XlockReservation -Xnoloa -Xlp -Xconcurrentlevel0 -Xthr:minimizeusercpu -Xgcthreads2 |
| JVM Affinity: | start /affinity [F, F0, F00, F000, F0000, F00000, F000000, F0000000, F00000000, F000000000, F0000000000, F00000000000, F000000000000, F0000000000000, F00000000000000, F000000000000000] |
| JVM Instances: | 16 |
| JVM Initial Heap (MB): | 1875 |
| JVM Maximum Heap (MB): | 1875 |
| JVM Address Bits: | 64 |
| Boot Firmware Version: | 3.0.3 |
| Management Firmware Version: | iDRAC 3.45 build 1 |
| Workload Version: | SSJ 1.2.10 |
| Director Location: | Controller |
| Other Software: | IBM SDK Java Technology Edition Version 7.0 for Windows x64 |
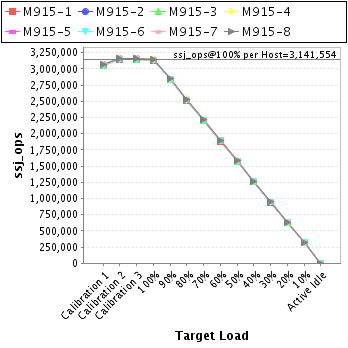
| Host | ssj_ops@100% |
|---|---|
| M915-1 | 3,132,378 |
| M915-2 | 3,138,320 |
| M915-3 | 3,140,007 |
| M915-4 | 3,153,663 |
| M915-5 | 3,141,244 |
| M915-6 | 3,125,002 |
| M915-7 | 3,154,443 |
| M915-8 | 3,147,371 |
| ssj_ops@100% | 25,132,429 |
| ssj_ops@100% per Host | 3,141,554 |
| ssj_ops@100% per JVM | 196,347 |
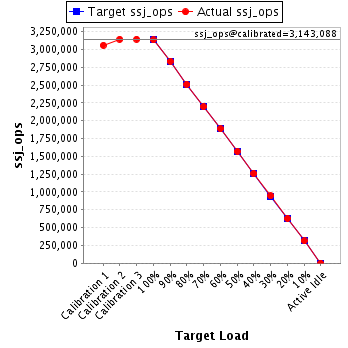
| Target Load | Actual Load | ssj_ops | |
|---|---|---|---|
| Target | Actual | ||
| Calibration 1 | 3,058,900 | ||
| Calibration 2 | 3,142,249 | ||
| Calibration 3 | 3,143,928 | ||
| ssj_ops@calibrated=3,143,088 | |||
| 100% | 99.7% | 3,143,088 | 3,132,378 |
| 90% | 90.2% | 2,828,780 | 2,834,153 |
| 80% | 79.9% | 2,514,471 | 2,510,442 |
| 70% | 69.9% | 2,200,162 | 2,196,111 |
| 60% | 60.0% | 1,885,853 | 1,885,213 |
| 50% | 50.0% | 1,571,544 | 1,570,443 |
| 40% | 40.0% | 1,257,235 | 1,257,884 |
| 30% | 30.0% | 942,927 | 944,011 |
| 20% | 20.0% | 628,618 | 628,846 |
| 10% | 10.0% | 314,309 | 313,569 |
| Active Idle | 0 | 0 | |
| Target Load | Actual Load | ssj_ops | |
|---|---|---|---|
| Target | Actual | ||
| Calibration 1 | 3,062,291 | ||
| Calibration 2 | 3,153,533 | ||
| Calibration 3 | 3,154,051 | ||
| ssj_ops@calibrated=3,153,792 | |||
| 100% | 99.5% | 3,153,792 | 3,138,320 |
| 90% | 90.0% | 2,838,413 | 2,836,984 |
| 80% | 79.9% | 2,523,033 | 2,520,731 |
| 70% | 70.1% | 2,207,654 | 2,209,886 |
| 60% | 60.0% | 1,892,275 | 1,892,462 |
| 50% | 49.9% | 1,576,896 | 1,573,881 |
| 40% | 40.1% | 1,261,517 | 1,263,447 |
| 30% | 30.0% | 946,138 | 945,092 |
| 20% | 20.0% | 630,758 | 630,758 |
| 10% | 10.0% | 315,379 | 314,885 |
| Active Idle | 0 | 0 | |

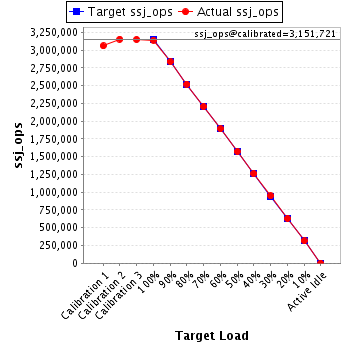
| Target Load | Actual Load | ssj_ops | |
|---|---|---|---|
| Target | Actual | ||
| Calibration 1 | 3,058,128 | ||
| Calibration 2 | 3,153,949 | ||
| Calibration 3 | 3,149,492 | ||
| ssj_ops@calibrated=3,151,721 | |||
| 100% | 99.6% | 3,151,721 | 3,140,007 |
| 90% | 90.0% | 2,836,549 | 2,835,613 |
| 80% | 80.0% | 2,521,377 | 2,521,508 |
| 70% | 70.0% | 2,206,204 | 2,207,005 |
| 60% | 60.0% | 1,891,032 | 1,891,628 |
| 50% | 49.9% | 1,575,860 | 1,572,898 |
| 40% | 40.0% | 1,260,688 | 1,260,684 |
| 30% | 30.1% | 945,516 | 947,290 |
| 20% | 20.0% | 630,344 | 629,215 |
| 10% | 10.0% | 315,172 | 314,496 |
| Active Idle | 0 | 0 | |
| Target Load | Actual Load | ssj_ops | |
|---|---|---|---|
| Target | Actual | ||
| Calibration 1 | 3,074,450 | ||
| Calibration 2 | 3,165,040 | ||
| Calibration 3 | 3,160,338 | ||
| ssj_ops@calibrated=3,162,689 | |||
| 100% | 99.7% | 3,162,689 | 3,153,663 |
| 90% | 89.9% | 2,846,420 | 2,842,624 |
| 80% | 80.2% | 2,530,151 | 2,535,112 |
| 70% | 70.0% | 2,213,882 | 2,214,273 |
| 60% | 60.1% | 1,897,613 | 1,902,265 |
| 50% | 50.1% | 1,581,344 | 1,584,312 |
| 40% | 40.1% | 1,265,075 | 1,269,182 |
| 30% | 30.0% | 948,807 | 949,374 |
| 20% | 20.0% | 632,538 | 631,478 |
| 10% | 10.0% | 316,269 | 315,297 |
| Active Idle | 0 | 0 | |

| Target Load | Actual Load | ssj_ops | |
|---|---|---|---|
| Target | Actual | ||
| Calibration 1 | 3,060,694 | ||
| Calibration 2 | 3,155,149 | ||
| Calibration 3 | 3,154,807 | ||
| ssj_ops@calibrated=3,154,978 | |||
| 100% | 99.6% | 3,154,978 | 3,141,244 |
| 90% | 90.1% | 2,839,480 | 2,842,060 |
| 80% | 80.1% | 2,523,982 | 2,525,755 |
| 70% | 70.1% | 2,208,485 | 2,212,467 |
| 60% | 60.0% | 1,892,987 | 1,893,642 |
| 50% | 50.0% | 1,577,489 | 1,577,952 |
| 40% | 40.0% | 1,261,991 | 1,262,326 |
| 30% | 30.1% | 946,493 | 948,243 |
| 20% | 20.0% | 630,996 | 631,051 |
| 10% | 10.0% | 315,498 | 317,035 |
| Active Idle | 0 | 0 | |

| Target Load | Actual Load | ssj_ops | |
|---|---|---|---|
| Target | Actual | ||
| Calibration 1 | 3,053,013 | ||
| Calibration 2 | 3,142,728 | ||
| Calibration 3 | 3,140,594 | ||
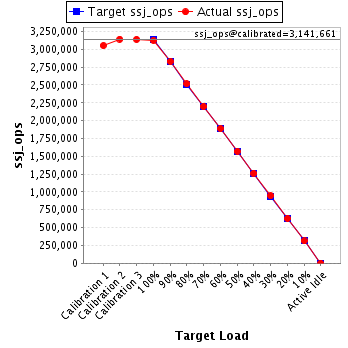
| ssj_ops@calibrated=3,141,661 | |||
| 100% | 99.5% | 3,141,661 | 3,125,002 |
| 90% | 90.1% | 2,827,495 | 2,831,839 |
| 80% | 80.1% | 2,513,329 | 2,517,034 |
| 70% | 70.0% | 2,199,163 | 2,199,337 |
| 60% | 60.1% | 1,884,997 | 1,887,761 |
| 50% | 50.0% | 1,570,831 | 1,570,368 |
| 40% | 40.1% | 1,256,665 | 1,260,973 |
| 30% | 30.1% | 942,498 | 944,727 |
| 20% | 20.0% | 628,332 | 627,105 |
| 10% | 10.0% | 314,166 | 312,911 |
| Active Idle | 0 | 0 | |
| Target Load | Actual Load | ssj_ops | |
|---|---|---|---|
| Target | Actual | ||
| Calibration 1 | 3,079,379 | ||
| Calibration 2 | 3,163,553 | ||
| Calibration 3 | 3,160,729 | ||
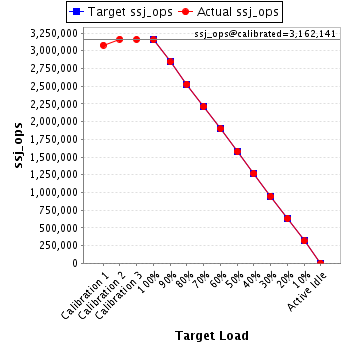
| ssj_ops@calibrated=3,162,141 | |||
| 100% | 99.8% | 3,162,141 | 3,154,443 |
| 90% | 89.9% | 2,845,927 | 2,842,189 |
| 80% | 79.9% | 2,529,713 | 2,527,656 |
| 70% | 70.0% | 2,213,499 | 2,212,078 |
| 60% | 60.0% | 1,897,285 | 1,897,717 |
| 50% | 49.9% | 1,581,071 | 1,577,083 |
| 40% | 40.0% | 1,264,856 | 1,266,117 |
| 30% | 29.9% | 948,642 | 946,974 |
| 20% | 20.0% | 632,428 | 632,238 |
| 10% | 10.0% | 316,214 | 315,127 |
| Active Idle | 0 | 0 | |
| Target Load | Actual Load | ssj_ops | |
|---|---|---|---|
| Target | Actual | ||
| Calibration 1 | 3,067,302 | ||
| Calibration 2 | 3,158,614 | ||
| Calibration 3 | 3,157,065 | ||
| ssj_ops@calibrated=3,157,839 | |||
| 100% | 99.7% | 3,157,839 | 3,147,371 |
| 90% | 90.1% | 2,842,055 | 2,843,977 |
| 80% | 80.1% | 2,526,271 | 2,530,016 |
| 70% | 70.1% | 2,210,488 | 2,214,810 |
| 60% | 59.9% | 1,894,704 | 1,892,653 |
| 50% | 50.0% | 1,578,920 | 1,578,924 |
| 40% | 40.0% | 1,263,136 | 1,264,586 |
| 30% | 30.0% | 947,352 | 946,900 |
| 20% | 20.1% | 631,568 | 634,305 |
| 10% | 10.0% | 315,784 | 315,643 |
| Active Idle | 0 | 0 | |
