SPECpower_ssj2008
Host 'WIN-O7O6EHP5IVF' Performance Report
Copyright © 2007-2013 Standard Performance Evaluation Corporation
| Hitachi, Ltd. HA8000/SS10 (DL2) | ssj_ops@100% = 407,490 ssj_ops@100% per JVM = 203,745 |
||||
| Test Sponsor: | Hitachi, Ltd. | SPEC License #: | 35 | Test Method: | Single Node |
| Tested By: | Hitachi, Ltd. | Test Location: | Hadano, Kanagawa, Japan | Test Date: | Mar 5, 2013 |
| Hardware Availability: | Nov-2012 | Software Availability: | Jun-2012 | Publication: | Mar 20, 2013 |
| System Source: | Single Supplier | System Designation: | Server | Power Provisioning: | Line-powered |
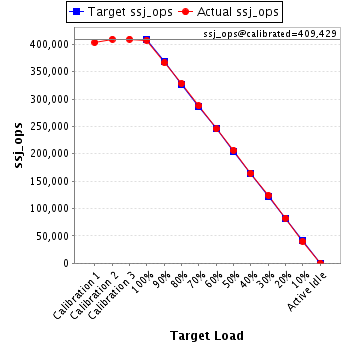
| Target Load | Actual Load | ssj_ops | |
|---|---|---|---|
| Target | Actual | ||
| Calibration 1 | 403,511 | ||
| Calibration 2 | 409,357 | ||
| Calibration 3 | 409,500 | ||
| ssj_ops@calibrated=409,429 | |||
| 100% | 99.5% | 409,429 | 407,490 |
| 90% | 89.6% | 368,486 | 366,656 |
| 80% | 80.3% | 327,543 | 328,687 |
| 70% | 70.2% | 286,600 | 287,602 |
| 60% | 60.0% | 245,657 | 245,648 |
| 50% | 50.4% | 204,714 | 206,433 |
| 40% | 40.1% | 163,772 | 164,312 |
| 30% | 30.3% | 122,829 | 124,130 |
| 20% | 20.2% | 81,886 | 82,640 |
| 10% | 9.8% | 40,943 | 39,991 |
| Active Idle | 0 | 0 | |
| Set Identifier: | sut |
| Set Description: | System Under Test |
| # of Identical Nodes: | 1 |
| Comment: | None |
| Hardware | |
|---|---|
| Hardware Vendor: | Hitachi, Ltd. |
| Model: | HA8000/SS10 (DL2) |
| Form Factor: | Tower |
| CPU Name: | Intel Xeon E3-1220v2 (Intel Turbo Boost Technology up to 3.50 GHz) |
| CPU Characteristics: | Quad Core, 3.10GHz, 8MB L3 Cache |
| CPU Frequency (MHz): | 3100 |
| CPU(s) Enabled: | 4 cores, 1 chip, 4 cores/chip |
| Hardware Threads: | 4 (1 / core) |
| CPU(s) Orderable: | 1 chip |
| Primary Cache: | 32 KB I + 32 KB D on chip per core |
| Secondary Cache: | 256 KB I+D on chip per core |
| Tertiary Cache: | 8 MB I+D on chip per chip |
| Other Cache: | None |
| Memory Amount (GB): | 8 |
| # and size of DIMM: | 2 x 4096 GB |
| Memory Details: | 4GB 2Rx8 PC3L-12800E ECC CL11; slots DIMM_#2 and DIMM_#4 populated |
| Power Supply Quantity and Rating (W): | 1 x 250 |
| Power Supply Details: | Lead Year TG10-0250-01 |
| Disk Drive: | 1 x 500GB SATA (Hitachi P/N:GQ-UH75006S) |
| Disk Controller: | Integrated SATA controller |
| # and type of Network Interface Cards (NICs) Installed: | 1 x Dual-Port Broadcom BCM5718 Gigabit Network Connection (onboard) |
| NICs Enabled in Firmware / OS / Connected: | 2/1/1 |
| Network Speed (Mbit): | 1000 |
| Keyboard: | None |
| Mouse: | None |
| Monitor: | None |
| Optical Drives: | Yes |
| Other Hardware: | None |
| Software | |
|---|---|
| Power Management: | Enabled (Power saver) |
| Operating System (OS): | Microsoft Windows Server 2008 R2 Enterprise SP1 |
| OS Version: | R2 |
| Filesystem: | NTFS |
| JVM Vendor: | IBM Corporation |
| JVM Version: | IBM J9 VM (build 2.6,JRE 1.7.0 Windows Server 2008 R2 amd64-64 20120322_106209 JIT enabled, AOT enabled) |
| JVM Command-line Options: | -Xaggressive -Xcompressedrefs -Xgcpolicy:gencon -Xms1950m -Xmx1950m -Xmn1400m -XlockReservation -Xnoloa -XtlhPrefetch -Xlp |
| JVM Affinity: | start /affinity [3,C] |
| JVM Instances: | 2 |
| JVM Initial Heap (MB): | 1950 |
| JVM Maximum Heap (MB): | 1950 |
| JVM Address Bits: | 64 |
| Boot Firmware Version: | LU.1.00.01 |
| Management Firmware Version: | 06.33 |
| Workload Version: | SSJ 1.2.10 |
| Director Location: | Controller |
| Other Software: | IBM SDK Java Technology Edition Version 7.0 for Windows x64 |
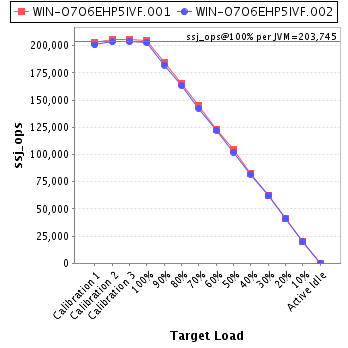
| JVM Instance | ssj_ops@100% |
|---|---|
| WIN-O7O6EHP5IVF.001 | 204,675 |
| WIN-O7O6EHP5IVF.002 | 202,815 |
| ssj_ops@100% | 407,490 |
| ssj_ops@100% per JVM | 203,745 |
| Target Load | Actual Load | ssj_ops | |
|---|---|---|---|
| Target | Actual | ||
| Calibration 1 | 202,869 | ||
| Calibration 2 | 205,900 | ||
| Calibration 3 | 205,981 | ||
| ssj_ops@calibrated=205,940 | |||
| 100% | 99.4% | 205,940 | 204,675 |
| 90% | 89.6% | 185,346 | 184,439 |
| 80% | 80.3% | 164,752 | 165,469 |
| 70% | 70.5% | 144,158 | 145,255 |
| 60% | 59.8% | 123,564 | 123,229 |
| 50% | 50.6% | 102,970 | 104,239 |
| 40% | 40.1% | 82,376 | 82,528 |
| 30% | 30.1% | 61,782 | 62,003 |
| 20% | 20.2% | 41,188 | 41,501 |
| 10% | 9.9% | 20,594 | 20,408 |
| Active Idle | 0 | 0 | |

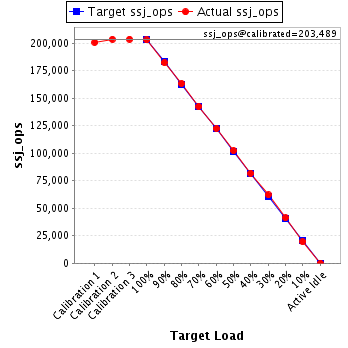
| Target Load | Actual Load | ssj_ops | |
|---|---|---|---|
| Target | Actual | ||
| Calibration 1 | 200,643 | ||
| Calibration 2 | 203,458 | ||
| Calibration 3 | 203,519 | ||
| ssj_ops@calibrated=203,489 | |||
| 100% | 99.7% | 203,489 | 202,815 |
| 90% | 89.5% | 183,140 | 182,217 |
| 80% | 80.2% | 162,791 | 163,218 |
| 70% | 70.0% | 142,442 | 142,347 |
| 60% | 60.2% | 122,093 | 122,419 |
| 50% | 50.2% | 101,744 | 102,194 |
| 40% | 40.2% | 81,395 | 81,784 |
| 30% | 30.5% | 61,047 | 62,126 |
| 20% | 20.2% | 40,698 | 41,139 |
| 10% | 9.6% | 20,349 | 19,583 |
| Active Idle | 0 | 0 | |