SPECpower_ssj2008
Host 'RUBYDICE' Performance Report
Copyright © 2007-2013 Standard Performance Evaluation Corporation
| NEC Corporation Express5800/GT110f-S | ssj_ops@100% = 397,309 ssj_ops@100% per JVM = 198,654 |
||||
| Test Sponsor: | NEC Corporation | SPEC License #: | 9006 | Test Method: | Single Node |
| Tested By: | NEC Corporation | Test Location: | Fuchu, Tokyo, Japan | Test Date: | May 30, 2013 |
| Hardware Availability: | Jul-2013 | Software Availability: | Apr-2013 | Publication: | Jun 26, 2013 |
| System Source: | Single Supplier | System Designation: | Server | Power Provisioning: | Line-powered |
| Target Load | Actual Load | ssj_ops | |
|---|---|---|---|
| Target | Actual | ||
| Calibration 1 | 395,038 | ||
| Calibration 2 | 398,431 | ||
| Calibration 3 | 397,951 | ||
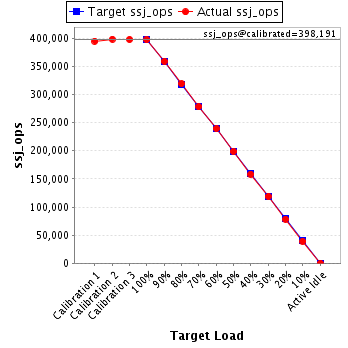
| ssj_ops@calibrated=398,191 | |||
| 100% | 99.8% | 398,191 | 397,309 |
| 90% | 90.2% | 358,372 | 359,163 |
| 80% | 80.2% | 318,553 | 319,205 |
| 70% | 69.9% | 278,734 | 278,214 |
| 60% | 60.1% | 238,915 | 239,326 |
| 50% | 50.0% | 199,095 | 199,080 |
| 40% | 39.8% | 159,276 | 158,591 |
| 30% | 29.9% | 119,457 | 118,897 |
| 20% | 19.7% | 79,638 | 78,375 |
| 10% | 9.8% | 39,819 | 39,122 |
| Active Idle | 0 | 0 | |
| Set Identifier: | sut |
| Set Description: | Express5800/GT110f-S (Intel Xeon E3-1265LV3, 2.50 GHz) |
| # of Identical Nodes: | 1 |
| Comment: | None |
| Hardware | |
|---|---|
| Hardware Vendor: | NEC Corporation |
| Model: | Express5800/GT110f-S |
| Form Factor: | Tower |
| CPU Name: | Intel Xeon E3-1265LV3 |
| CPU Characteristics: | 4-Core, 2.50 GHz, 8 MB L3 Cache |
| CPU Frequency (MHz): | 2500 |
| CPU(s) Enabled: | 4 cores, 1 chip, 4 cores/chip |
| Hardware Threads: | 8 (2 / core) |
| CPU(s) Orderable: | 1 chip |
| Primary Cache: | 32 KB I + 32 KB D on chip per core |
| Secondary Cache: | 256 KB I+D on chip per core |
| Tertiary Cache: | 8 MB I+D on chip per chip |
| Other Cache: | None |
| Memory Amount (GB): | 8 |
| # and size of DIMM: | 2 x 4096 MB |
| Memory Details: | 4GB 2Rx8 PC3L-12800E ECC CL11; slots DIMM1 and DIMM2 populated |
| Power Supply Quantity and Rating (W): | 1 x 250 |
| Power Supply Details: | TIGER POWER TG12-0250-01 |
| Disk Drive: | 1 x 250GB 7200rpm HDD 2.5inch SATA, NEC P/N:N8150-356 |
| Disk Controller: | Integrated SATA controller |
| # and type of Network Interface Cards (NICs) Installed: | 1 x Integrated Broadcom BCM5718 Dual-Port Gigabit Ethernet Controller |
| NICs Enabled in Firmware / OS / Connected: | 2/1/1 |
| Network Speed (Mbit): | 1000 |
| Keyboard: | None |
| Mouse: | None |
| Monitor: | None |
| Optical Drives: | No |
| Other Hardware: | 1 x 2.5-inch Drive Cage, NEC P/N:N8154-59; 1 x ODD Bay Cover, NEC P/N:N8151-121 |
| Software | |
|---|---|
| Power Management: | Power saver |
| Operating System (OS): | Microsoft Windows Server 2008 R2 Enterprise |
| OS Version: | SP1 |
| Filesystem: | NTFS |
| JVM Vendor: | Oracle Corporation |
| JVM Version: | Oracle Java HotSpot(TM) 64-Bit Server VM on Windows, version 1.6.0_45 |
| JVM Command-line Options: | -Xms1600m -Xmx1600m -Xmn1200m -XX:+AggressiveOpts -XX:+UseCompressedStrings -XX:ParallelGCThreads=4 -XX:+UseLargePages -XX:AllocatePrefetchDistance=256 -XX:AllocatePrefetchLines=4 -XX:SurvivorRatio=60 -XX:TargetSurvivorRatio=90 -XX:InlineSmallCode=3900 -XX:MaxInlineSize=270 -XX:FreqInlineSize=2500 -XX:LoopUnrollLimit=45 -XX:InitialTenuringThreshold=12 -XX:MaxTenuringThreshold=15 -XX:+UseBiasedLocking |
| JVM Affinity: | start /affinity [F,F0] |
| JVM Instances: | 2 |
| JVM Initial Heap (MB): | 1600 |
| JVM Maximum Heap (MB): | 1600 |
| JVM Address Bits: | 64 |
| Boot Firmware Version: | 4.6.0011 |
| Management Firmware Version: | 00.07 |
| Workload Version: | SSJ 1.2.10 |
| Director Location: | Controller |
| Other Software: | None |
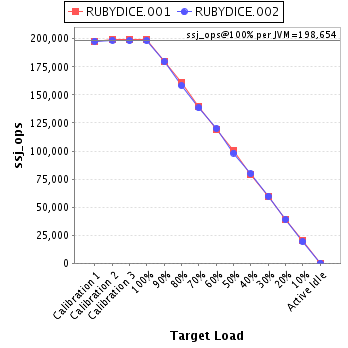
| JVM Instance | ssj_ops@100% |
|---|---|
| RUBYDICE.001 | 199,010 |
| RUBYDICE.002 | 198,299 |
| ssj_ops@100% | 397,309 |
| ssj_ops@100% per JVM | 198,654 |
| Target Load | Actual Load | ssj_ops | |
|---|---|---|---|
| Target | Actual | ||
| Calibration 1 | 197,223 | ||
| Calibration 2 | 199,648 | ||
| Calibration 3 | 199,639 | ||
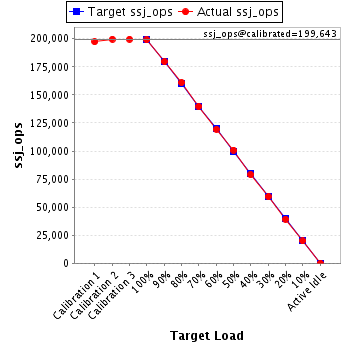
| ssj_ops@calibrated=199,643 | |||
| 100% | 99.7% | 199,643 | 199,010 |
| 90% | 90.0% | 179,679 | 179,617 |
| 80% | 80.6% | 159,715 | 161,002 |
| 70% | 70.0% | 139,750 | 139,729 |
| 60% | 59.8% | 119,786 | 119,386 |
| 50% | 50.5% | 99,822 | 100,889 |
| 40% | 39.5% | 79,857 | 78,841 |
| 30% | 29.7% | 59,893 | 59,353 |
| 20% | 19.7% | 39,929 | 39,374 |
| 10% | 10.0% | 19,964 | 19,866 |
| Active Idle | 0 | 0 | |
| Target Load | Actual Load | ssj_ops | |
|---|---|---|---|
| Target | Actual | ||
| Calibration 1 | 197,815 | ||
| Calibration 2 | 198,783 | ||
| Calibration 3 | 198,312 | ||
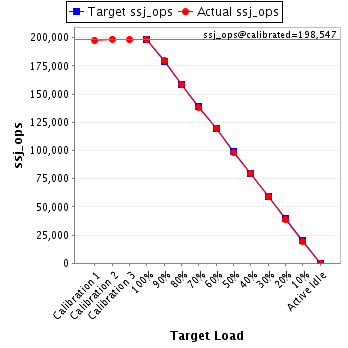
| ssj_ops@calibrated=198,547 | |||
| 100% | 99.9% | 198,547 | 198,299 |
| 90% | 90.4% | 178,693 | 179,546 |
| 80% | 79.7% | 158,838 | 158,204 |
| 70% | 69.7% | 138,983 | 138,485 |
| 60% | 60.4% | 119,128 | 119,940 |
| 50% | 49.5% | 99,274 | 98,191 |
| 40% | 40.2% | 79,419 | 79,750 |
| 30% | 30.0% | 59,564 | 59,544 |
| 20% | 19.6% | 39,709 | 39,001 |
| 10% | 9.7% | 19,855 | 19,256 |
| Active Idle | 0 | 0 | |