SPECpower_ssj2008
Host 'WIN-BTR51M8MNK5' Performance Report
Copyright © 2007-2013 Standard Performance Evaluation Corporation
| Fujitsu PRIMERGY TX140 S2 (Intel Xeon E3-1265Lv3) | ssj_ops@100% = 491,887 ssj_ops@100% per JVM = 122,972 |
||||
| Test Sponsor: | Fujitsu | SPEC License #: | 19 | Test Method: | Single Node |
| Tested By: | Fujitsu | Test Location: | Paderborn, NRW, Germany | Test Date: | Jul 27, 2013 |
| Hardware Availability: | Sep-2013 | Software Availability: | Jun-2012 | Publication: | Oct 2, 2013 |
| System Source: | Single Supplier | System Designation: | Server | Power Provisioning: | Line-powered |
| Target Load | Actual Load | ssj_ops | |
|---|---|---|---|
| Target | Actual | ||
| Calibration 1 | 474,741 | ||
| Calibration 2 | 491,089 | ||
| Calibration 3 | 491,554 | ||
| ssj_ops@calibrated=491,322 | |||
| 100% | 100.1% | 491,322 | 491,887 |
| 90% | 91.9% | 442,190 | 451,332 |
| 80% | 79.8% | 393,057 | 392,082 |
| 70% | 70.6% | 343,925 | 346,799 |
| 60% | 60.2% | 294,793 | 295,994 |
| 50% | 50.0% | 245,661 | 245,545 |
| 40% | 40.2% | 196,529 | 197,311 |
| 30% | 30.0% | 147,397 | 147,529 |
| 20% | 19.9% | 98,264 | 98,010 |
| 10% | 10.1% | 49,132 | 49,620 |
| Active Idle | 0 | 0 | |

| Set Identifier: | TX140 S2 |
| Set Description: | System Under Test |
| # of Identical Nodes: | 1 |
| Comment: | Single Node |
| Hardware | |
|---|---|
| Hardware Vendor: | Fujitsu |
| Model: | PRIMERGY TX140 S2 (Intel Xeon E3-1265Lv3) |
| Form Factor: | Tower |
| CPU Name: | Intel Xeon E3-1265Lv3 |
| CPU Characteristics: | 4-Core, 2.50GHz, 8MB L3 Cache (Turbo Boost Technology up to 3.70 GHz) |
| CPU Frequency (MHz): | 2500 |
| CPU(s) Enabled: | 4 cores, 1 chip, 4 cores/chip |
| Hardware Threads: | 8 (2 / core) |
| CPU(s) Orderable: | 1 chip |
| Primary Cache: | 32 KB I + 32 KB D on chip per core |
| Secondary Cache: | 256 KB I+D on chip per core |
| Tertiary Cache: | 8 MB I+D on chip per chip |
| Other Cache: | None |
| Memory Amount (GB): | 8 |
| # and size of DIMM: | 2 x 4096 MB |
| Memory Details: | 4 GB 2Rx8 PC3L-12800E-11, ECC; slots 1A, 1B populated |
| Power Supply Quantity and Rating (W): | 1 x 300 |
| Power Supply Details: | Fujitsu Technology Solutions S26113-E581-V50 |
| Disk Drive: | 1 x 250GB, HDD, 2.5" SATA, S26361-F3708-E250 |
| Disk Controller: | Integrated SATA Controller |
| # and type of Network Interface Cards (NICs) Installed: | 1 x Intel I210 and 1 x Intel I217LM Gigabit Network Connection (onboard) |
| NICs Enabled in Firmware / OS / Connected: | 1/1/1 |
| Network Speed (Mbit): | 1000 |
| Keyboard: | None |
| Mouse: | None |
| Monitor: | None |
| Optical Drives: | No |
| Other Hardware: | None |
| Software | |
|---|---|
| Power Management: | Enabled ("Fujitsu Enhanced Power Settings" power plan) |
| Operating System (OS): | Microsoft Windows Server 2008 R2 Enterprise SP1 |
| OS Version: | Version 6.1.7601 Service Pack 1 Build 7601 |
| Filesystem: | NTFS |
| JVM Vendor: | IBM Corporation |
| JVM Version: | IBM J9 VM (build 2.6, JRE 1.7.0 Windows Server 2008 R2 amd64-64 20120322_106209 (JIT enabled, AOT enabled) |
| JVM Command-line Options: | -Xaggressive -Xcompressedrefs -Xmx1024m -Xms1024m -Xmn800m -XlockReservation -Xnoloa -XtlhPrefetch -Xlp -Xconcurrentlevel0 -Xthr:minimizeusercpu |
| JVM Affinity: | start /AFFINITY [0x3,0xC,0x30,0xC0] |
| JVM Instances: | 4 |
| JVM Initial Heap (MB): | 1024 |
| JVM Maximum Heap (MB): | 1024 |
| JVM Address Bits: | 64 |
| Boot Firmware Version: | R0.92.0 |
| Management Firmware Version: | 0.43F |
| Workload Version: | SSJ 1.2.10 |
| Director Location: | Controller |
| Other Software: | IBM SDK Java Technology Edition Version 7.0 for Windows x64 |
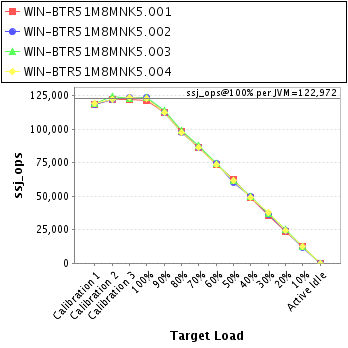
| JVM Instance | ssj_ops@100% |
|---|---|
| WIN-BTR51M8MNK5.001 | 121,517 |
| WIN-BTR51M8MNK5.002 | 123,825 |
| WIN-BTR51M8MNK5.003 | 123,576 |
| WIN-BTR51M8MNK5.004 | 122,968 |
| ssj_ops@100% | 491,887 |
| ssj_ops@100% per JVM | 122,972 |
| Target Load | Actual Load | ssj_ops | |
|---|---|---|---|
| Target | Actual | ||
| Calibration 1 | 118,154 | ||
| Calibration 2 | 122,406 | ||
| Calibration 3 | 122,357 | ||
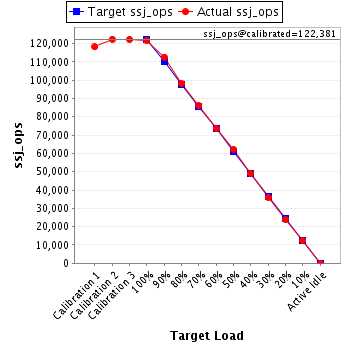
| ssj_ops@calibrated=122,381 | |||
| 100% | 99.3% | 122,381 | 121,517 |
| 90% | 92.1% | 110,143 | 112,662 |
| 80% | 80.1% | 97,905 | 98,087 |
| 70% | 70.3% | 85,667 | 86,062 |
| 60% | 60.2% | 73,429 | 73,642 |
| 50% | 50.9% | 61,191 | 62,237 |
| 40% | 40.1% | 48,953 | 49,113 |
| 30% | 29.4% | 36,714 | 35,928 |
| 20% | 19.5% | 24,476 | 23,829 |
| 10% | 10.1% | 12,238 | 12,337 |
| Active Idle | 0 | 0 | |
| Target Load | Actual Load | ssj_ops | |
|---|---|---|---|
| Target | Actual | ||
| Calibration 1 | 118,183 | ||
| Calibration 2 | 121,756 | ||
| Calibration 3 | 123,460 | ||
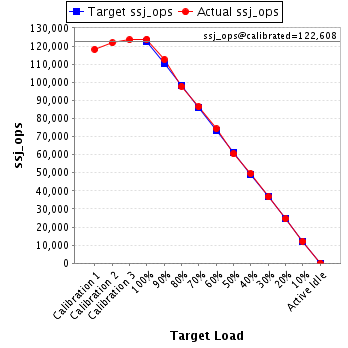
| ssj_ops@calibrated=122,608 | |||
| 100% | 101.0% | 122,608 | 123,825 |
| 90% | 91.8% | 110,347 | 112,561 |
| 80% | 79.7% | 98,086 | 97,702 |
| 70% | 70.5% | 85,825 | 86,494 |
| 60% | 60.6% | 73,565 | 74,326 |
| 50% | 49.3% | 61,304 | 60,418 |
| 40% | 40.4% | 49,043 | 49,559 |
| 30% | 29.9% | 36,782 | 36,699 |
| 20% | 20.0% | 24,522 | 24,550 |
| 10% | 9.9% | 12,261 | 12,116 |
| Active Idle | 0 | 0 | |
| Target Load | Actual Load | ssj_ops | |
|---|---|---|---|
| Target | Actual | ||
| Calibration 1 | 119,326 | ||
| Calibration 2 | 124,526 | ||
| Calibration 3 | 122,451 | ||
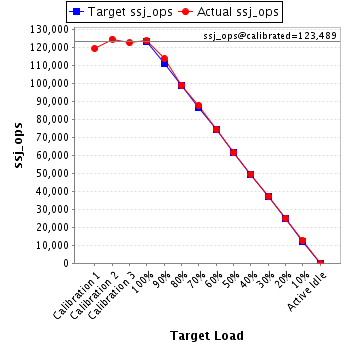
| ssj_ops@calibrated=123,489 | |||
| 100% | 100.1% | 123,489 | 123,576 |
| 90% | 92.0% | 111,140 | 113,612 |
| 80% | 80.2% | 98,791 | 99,012 |
| 70% | 71.1% | 86,442 | 87,763 |
| 60% | 60.4% | 74,093 | 74,566 |
| 50% | 49.8% | 61,744 | 61,466 |
| 40% | 40.1% | 49,395 | 49,552 |
| 30% | 30.3% | 37,047 | 37,375 |
| 20% | 20.2% | 24,698 | 24,913 |
| 10% | 10.2% | 12,349 | 12,537 |
| Active Idle | 0 | 0 | |
| Target Load | Actual Load | ssj_ops | |
|---|---|---|---|
| Target | Actual | ||
| Calibration 1 | 119,079 | ||
| Calibration 2 | 122,402 | ||
| Calibration 3 | 123,286 | ||
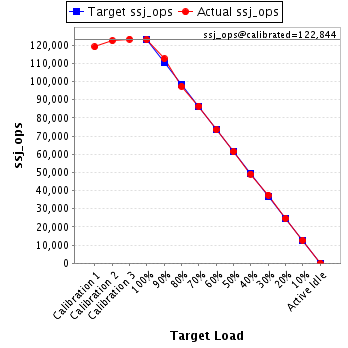
| ssj_ops@calibrated=122,844 | |||
| 100% | 100.1% | 122,844 | 122,968 |
| 90% | 91.6% | 110,560 | 112,497 |
| 80% | 79.2% | 98,275 | 97,281 |
| 70% | 70.4% | 85,991 | 86,481 |
| 60% | 59.8% | 73,706 | 73,460 |
| 50% | 50.0% | 61,422 | 61,424 |
| 40% | 40.0% | 49,138 | 49,088 |
| 30% | 30.5% | 36,853 | 37,526 |
| 20% | 20.1% | 24,569 | 24,717 |
| 10% | 10.3% | 12,284 | 12,631 |
| Active Idle | 0 | 0 | |