SPECpower_ssj2008
Host 'test' Performance Report
Copyright © 2007-2015 Standard Performance Evaluation Corporation
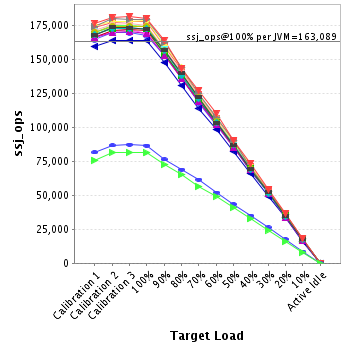
| Supermicro Inc. SYS-1028R-WC1RT | ssj_ops@100% = 2,935,596 ssj_ops@100% per JVM = 163,089 |
||||
| Test Sponsor: | Supermicro Inc. | SPEC License #: | 1176 | Test Method: | Single Node |
| Tested By: | Supermicro Inc. | Test Location: | Chung-Ho Dist,TW, R.O.C | Test Date: | Sep 25, 2014 |
| Hardware Availability: | Jan-2015 | Software Availability: | Sep-2012 | Publication: | Feb 11, 2015 |
| System Source: | Single Supplier | System Designation: | Server | Power Provisioning: | Line-powered |
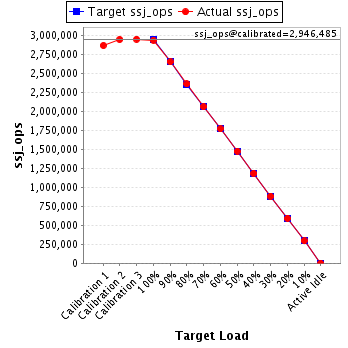
| Target Load | Actual Load | ssj_ops | |
|---|---|---|---|
| Target | Actual | ||
| Calibration 1 | 2,865,073 | ||
| Calibration 2 | 2,944,612 | ||
| Calibration 3 | 2,948,357 | ||
| ssj_ops@calibrated=2,946,485 | |||
| 100% | 99.6% | 2,946,485 | 2,935,596 |
| 90% | 89.9% | 2,651,836 | 2,649,490 |
| 80% | 80.1% | 2,357,188 | 2,359,135 |
| 70% | 69.9% | 2,062,539 | 2,059,455 |
| 60% | 60.0% | 1,767,891 | 1,767,074 |
| 50% | 50.1% | 1,473,242 | 1,475,925 |
| 40% | 40.1% | 1,178,594 | 1,181,345 |
| 30% | 30.0% | 883,945 | 883,970 |
| 20% | 20.1% | 589,297 | 591,825 |
| 10% | 10.0% | 294,648 | 294,178 |
| Active Idle | 0 | 0 | |
| Set Identifier: | sut |
| Set Description: | System Under Test |
| # of Identical Nodes: | 1 |
| Comment: | None |
| Hardware | |
|---|---|
| Hardware Vendor: | Supermicro Inc. |
| Model: | SYS-1028R-WC1RT |
| Form Factor: | 1U |
| CPU Name: | Intel Xeon E5-2699 v3 |
| CPU Characteristics: | 18-Core, 2.3GHz, 45MB L3 cache |
| CPU Frequency (MHz): | 2300 |
| CPU(s) Enabled: | 36 cores, 2 chips, 18 cores/chip |
| Hardware Threads: | 72 (2 / core) |
| CPU(s) Orderable: | 1,2 chips |
| Primary Cache: | 32 KB I + 32 KB D on chip per core |
| Secondary Cache: | 256 KB I+D on chip per core |
| Tertiary Cache: | 45 MB I+D on chip per chip |
| Other Cache: | None |
| Memory Amount (GB): | 32 |
| # and size of DIMM: | 8 x 4096 MB |
| Memory Details: | 4GB 1Rx4 PC3L-12800R; A1,B1,C1,D1,E1,F1,G1,H1 populated. |
| Power Supply Quantity and Rating (W): | 1 x 700 |
| Power Supply Details: | PWS-704P-1R |
| Disk Drive: | 1 x Seagate SATA III 100 GB SSD 9XW152-003 |
| Disk Controller: | onboard SCU controller |
| # and type of Network Interface Cards (NICs) Installed: | 1 x Dual-port Onboard Intel I350 Gigabit Ethernet controller |
| NICs Enabled in Firmware / OS / Connected: | 2/1/1 |
| Network Speed (Mbit): | 1000 |
| Keyboard: | KVM |
| Mouse: | KVM |
| Monitor: | KVM |
| Optical Drives: | No |
| Other Hardware: | None |
| Software | |
|---|---|
| Power Management: | Power Saver |
| Operating System (OS): | Microsoft Windows Server Enterprise 2008 R2 SP1 |
| OS Version: | 6.1.7601 Build 7601 (64-bit) |
| Filesystem: | NTFS |
| JVM Vendor: | IBM Corporation |
| JVM Version: | IBM J9 VM (build 2.6, JRE 1.7.0 Windows Server 2008 R2 amd64-64 20120322_106209 (JIT enabled, AOT enabled)) |
| JVM Command-line Options: | -Xtune:virtualized -server -showversion-Xmx1500m -Xms1500m -Xmn1300m -Xaggressive -Xcompressedrefs XlockReservation -Xnoloa -XtlhPrefetch -Xlp -Xthr:minimizeusercpu -Xconcurrentlevel16 -Xgcthreads8 -Xfastresolve -Xgcpolicy:gencon -Xcompactgc -Xgc:preferredHeapBase=0x80000000 |
| JVM Affinity: | start /affinity [F,F0,F00,F000,F0000,F00000,F000000,F0000000,F00000000,F000000000,F0000000000,F00000000000,F000000000000,F0000000000000,F00000000000000,F000000000000000,F0000000000000000,F00000000000000000] |
| JVM Instances: | 18 |
| JVM Initial Heap (MB): | 1500 |
| JVM Maximum Heap (MB): | 1500 |
| JVM Address Bits: | 64 |
| Boot Firmware Version: | X10DRW4.821 |
| Management Firmware Version: | 01.67 |
| Workload Version: | SSJ 1.2.10 |
| Director Location: | Controller |
| Other Software: | IBM WebSphere Application Server V8.5.0.0 |
| JVM Instance | ssj_ops@100% |
|---|---|
| test.001 | 177,695 |
| test.002 | 167,840 |
| test.003 | 174,117 |
| test.004 | 178,276 |
| test.005 | 169,234 |
| test.006 | 171,688 |
| test.007 | 175,238 |
| test.008 | 178,953 |
| test.009 | 171,134 |
| test.010 | 163,712 |
| test.011 | 172,671 |
| test.012 | 174,068 |
| test.013 | 168,866 |
| test.014 | 172,356 |
| test.015 | 172,021 |
| test.016 | 180,267 |
| test.017 | 86,319 |
| test.018 | 81,141 |
| ssj_ops@100% | 2,935,596 |
| ssj_ops@100% per JVM | 163,089 |
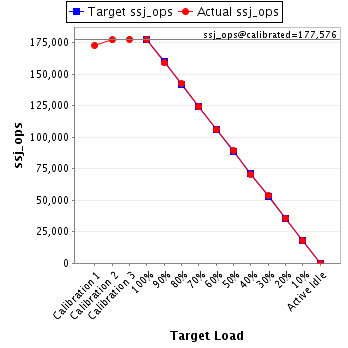
| Target Load | Actual Load | ssj_ops | |
|---|---|---|---|
| Target | Actual | ||
| Calibration 1 | 173,090 | ||
| Calibration 2 | 177,266 | ||
| Calibration 3 | 177,886 | ||
| ssj_ops@calibrated=177,576 | |||
| 100% | 100.1% | 177,576 | 177,695 |
| 90% | 89.6% | 159,818 | 159,098 |
| 80% | 80.3% | 142,061 | 142,566 |
| 70% | 69.9% | 124,303 | 124,170 |
| 60% | 59.8% | 106,546 | 106,119 |
| 50% | 50.3% | 88,788 | 89,304 |
| 40% | 39.9% | 71,030 | 70,825 |
| 30% | 30.2% | 53,273 | 53,556 |
| 20% | 20.1% | 35,515 | 35,766 |
| 10% | 10.1% | 17,758 | 17,862 |
| Active Idle | 0 | 0 | |
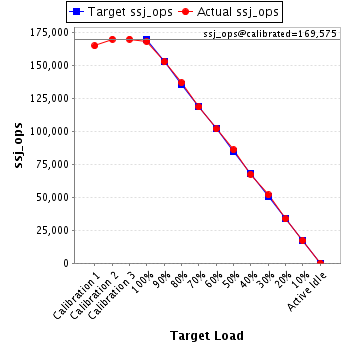
| Target Load | Actual Load | ssj_ops | |
|---|---|---|---|
| Target | Actual | ||
| Calibration 1 | 164,535 | ||
| Calibration 2 | 169,521 | ||
| Calibration 3 | 169,629 | ||
| ssj_ops@calibrated=169,575 | |||
| 100% | 99.0% | 169,575 | 167,840 |
| 90% | 89.9% | 152,617 | 152,488 |
| 80% | 80.5% | 135,660 | 136,535 |
| 70% | 69.8% | 118,702 | 118,309 |
| 60% | 59.9% | 101,745 | 101,652 |
| 50% | 50.6% | 84,787 | 85,867 |
| 40% | 39.7% | 67,830 | 67,285 |
| 30% | 30.5% | 50,872 | 51,724 |
| 20% | 19.8% | 33,915 | 33,535 |
| 10% | 10.1% | 16,957 | 17,119 |
| Active Idle | 0 | 0 | |
| Target Load | Actual Load | ssj_ops | |
|---|---|---|---|
| Target | Actual | ||
| Calibration 1 | 170,073 | ||
| Calibration 2 | 174,563 | ||
| Calibration 3 | 174,638 | ||
| ssj_ops@calibrated=174,600 | |||
| 100% | 99.7% | 174,600 | 174,117 |
| 90% | 89.2% | 157,140 | 155,780 |
| 80% | 80.0% | 139,680 | 139,605 |
| 70% | 70.3% | 122,220 | 122,689 |
| 60% | 59.8% | 104,760 | 104,378 |
| 50% | 50.3% | 87,300 | 87,756 |
| 40% | 40.0% | 69,840 | 69,834 |
| 30% | 29.8% | 52,380 | 51,976 |
| 20% | 20.2% | 34,920 | 35,324 |
| 10% | 10.1% | 17,460 | 17,592 |
| Active Idle | 0 | 0 | |

| Target Load | Actual Load | ssj_ops | |
|---|---|---|---|
| Target | Actual | ||
| Calibration 1 | 174,608 | ||
| Calibration 2 | 178,068 | ||
| Calibration 3 | 177,633 | ||
| ssj_ops@calibrated=177,850 | |||
| 100% | 100.2% | 177,850 | 178,276 |
| 90% | 90.0% | 160,065 | 160,090 |
| 80% | 81.1% | 142,280 | 144,206 |
| 70% | 69.7% | 124,495 | 123,893 |
| 60% | 60.4% | 106,710 | 107,435 |
| 50% | 49.9% | 88,925 | 88,824 |
| 40% | 40.5% | 71,140 | 72,028 |
| 30% | 29.9% | 53,355 | 53,150 |
| 20% | 20.1% | 35,570 | 35,812 |
| 10% | 9.8% | 17,785 | 17,504 |
| Active Idle | 0 | 0 | |

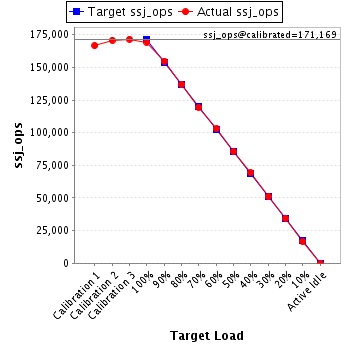
| Target Load | Actual Load | ssj_ops | |
|---|---|---|---|
| Target | Actual | ||
| Calibration 1 | 166,685 | ||
| Calibration 2 | 170,736 | ||
| Calibration 3 | 171,601 | ||
| ssj_ops@calibrated=171,169 | |||
| 100% | 98.9% | 171,169 | 169,234 |
| 90% | 90.5% | 154,052 | 154,862 |
| 80% | 80.1% | 136,935 | 137,049 |
| 70% | 69.9% | 119,818 | 119,572 |
| 60% | 60.2% | 102,701 | 103,012 |
| 50% | 50.0% | 85,584 | 85,612 |
| 40% | 40.4% | 68,468 | 69,169 |
| 30% | 29.8% | 51,351 | 51,089 |
| 20% | 20.1% | 34,234 | 34,425 |
| 10% | 9.9% | 17,117 | 16,886 |
| Active Idle | 0 | 0 | |
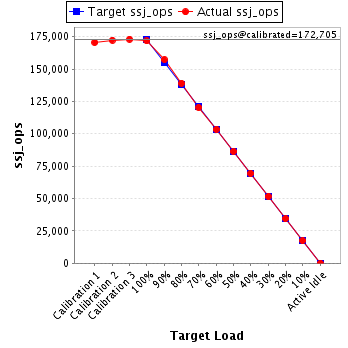
| Target Load | Actual Load | ssj_ops | |
|---|---|---|---|
| Target | Actual | ||
| Calibration 1 | 170,525 | ||
| Calibration 2 | 172,337 | ||
| Calibration 3 | 173,072 | ||
| ssj_ops@calibrated=172,705 | |||
| 100% | 99.4% | 172,705 | 171,688 |
| 90% | 91.1% | 155,434 | 157,271 |
| 80% | 80.6% | 138,164 | 139,157 |
| 70% | 69.7% | 120,893 | 120,321 |
| 60% | 59.9% | 103,623 | 103,474 |
| 50% | 50.1% | 86,352 | 86,480 |
| 40% | 40.2% | 69,082 | 69,449 |
| 30% | 29.9% | 51,811 | 51,676 |
| 20% | 19.9% | 34,541 | 34,408 |
| 10% | 10.1% | 17,270 | 17,500 |
| Active Idle | 0 | 0 | |
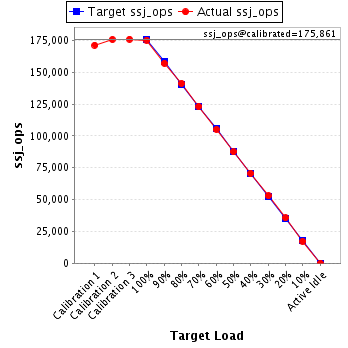
| Target Load | Actual Load | ssj_ops | |
|---|---|---|---|
| Target | Actual | ||
| Calibration 1 | 171,318 | ||
| Calibration 2 | 175,720 | ||
| Calibration 3 | 176,003 | ||
| ssj_ops@calibrated=175,861 | |||
| 100% | 99.6% | 175,861 | 175,238 |
| 90% | 89.3% | 158,275 | 157,080 |
| 80% | 80.4% | 140,689 | 141,316 |
| 70% | 70.0% | 123,103 | 123,134 |
| 60% | 59.8% | 105,517 | 105,164 |
| 50% | 49.7% | 87,931 | 87,447 |
| 40% | 40.2% | 70,344 | 70,626 |
| 30% | 30.1% | 52,758 | 52,967 |
| 20% | 20.2% | 35,172 | 35,582 |
| 10% | 9.8% | 17,586 | 17,268 |
| Active Idle | 0 | 0 | |
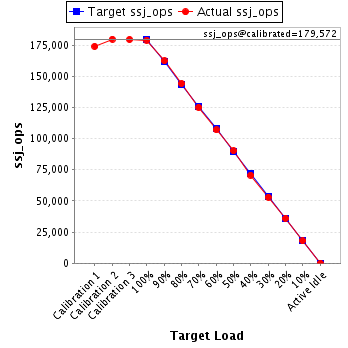
| Target Load | Actual Load | ssj_ops | |
|---|---|---|---|
| Target | Actual | ||
| Calibration 1 | 173,905 | ||
| Calibration 2 | 179,716 | ||
| Calibration 3 | 179,429 | ||
| ssj_ops@calibrated=179,572 | |||
| 100% | 99.7% | 179,572 | 178,953 |
| 90% | 90.4% | 161,615 | 162,262 |
| 80% | 80.3% | 143,658 | 144,137 |
| 70% | 69.6% | 125,701 | 124,967 |
| 60% | 59.6% | 107,743 | 106,941 |
| 50% | 50.2% | 89,786 | 90,132 |
| 40% | 39.3% | 71,829 | 70,650 |
| 30% | 29.5% | 53,872 | 53,038 |
| 20% | 20.1% | 35,914 | 36,054 |
| 10% | 10.0% | 17,957 | 17,975 |
| Active Idle | 0 | 0 | |
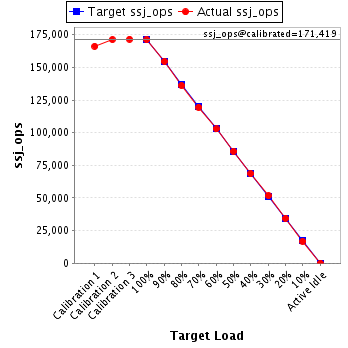
| Target Load | Actual Load | ssj_ops | |
|---|---|---|---|
| Target | Actual | ||
| Calibration 1 | 166,193 | ||
| Calibration 2 | 171,249 | ||
| Calibration 3 | 171,589 | ||
| ssj_ops@calibrated=171,419 | |||
| 100% | 99.8% | 171,419 | 171,134 |
| 90% | 90.2% | 154,277 | 154,593 |
| 80% | 79.3% | 137,135 | 135,970 |
| 70% | 69.7% | 119,993 | 119,426 |
| 60% | 60.0% | 102,852 | 102,840 |
| 50% | 50.1% | 85,710 | 85,841 |
| 40% | 40.0% | 68,568 | 68,504 |
| 30% | 30.2% | 51,426 | 51,737 |
| 20% | 20.1% | 34,284 | 34,502 |
| 10% | 9.8% | 17,142 | 16,829 |
| Active Idle | 0 | 0 | |
| Target Load | Actual Load | ssj_ops | |
|---|---|---|---|
| Target | Actual | ||
| Calibration 1 | 159,557 | ||
| Calibration 2 | 163,664 | ||
| Calibration 3 | 163,737 | ||
| ssj_ops@calibrated=163,701 | |||
| 100% | 100.0% | 163,701 | 163,712 |
| 90% | 90.1% | 147,331 | 147,473 |
| 80% | 79.9% | 130,960 | 130,776 |
| 70% | 69.7% | 114,590 | 114,092 |
| 60% | 60.1% | 98,220 | 98,391 |
| 50% | 50.4% | 81,850 | 82,440 |
| 40% | 40.1% | 65,480 | 65,715 |
| 30% | 30.0% | 49,110 | 49,083 |
| 20% | 20.4% | 32,740 | 33,387 |
| 10% | 9.8% | 16,370 | 16,104 |
| Active Idle | 0 | 0 | |

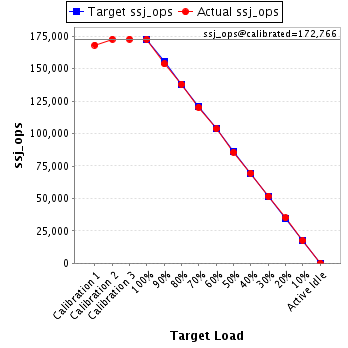
| Target Load | Actual Load | ssj_ops | |
|---|---|---|---|
| Target | Actual | ||
| Calibration 1 | 168,270 | ||
| Calibration 2 | 172,731 | ||
| Calibration 3 | 172,801 | ||
| ssj_ops@calibrated=172,766 | |||
| 100% | 99.9% | 172,766 | 172,671 |
| 90% | 89.0% | 155,490 | 153,760 |
| 80% | 80.0% | 138,213 | 138,128 |
| 70% | 69.6% | 120,936 | 120,185 |
| 60% | 60.0% | 103,660 | 103,677 |
| 50% | 49.5% | 86,383 | 85,599 |
| 40% | 40.2% | 69,106 | 69,469 |
| 30% | 29.9% | 51,830 | 51,679 |
| 20% | 20.3% | 34,553 | 35,007 |
| 10% | 10.2% | 17,277 | 17,591 |
| Active Idle | 0 | 0 | |
| Target Load | Actual Load | ssj_ops | |
|---|---|---|---|
| Target | Actual | ||
| Calibration 1 | 169,958 | ||
| Calibration 2 | 174,231 | ||
| Calibration 3 | 174,075 | ||
| ssj_ops@calibrated=174,153 | |||
| 100% | 100.0% | 174,153 | 174,068 |
| 90% | 89.9% | 156,738 | 156,617 |
| 80% | 79.8% | 139,322 | 138,985 |
| 70% | 70.0% | 121,907 | 121,865 |
| 60% | 59.7% | 104,492 | 103,944 |
| 50% | 49.6% | 87,077 | 86,405 |
| 40% | 40.2% | 69,661 | 69,970 |
| 30% | 30.0% | 52,246 | 52,330 |
| 20% | 20.1% | 34,831 | 35,045 |
| 10% | 10.0% | 17,415 | 17,434 |
| Active Idle | 0 | 0 | |

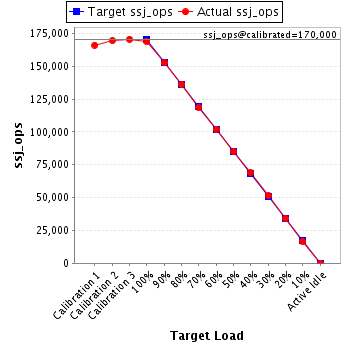
| Target Load | Actual Load | ssj_ops | |
|---|---|---|---|
| Target | Actual | ||
| Calibration 1 | 165,995 | ||
| Calibration 2 | 169,464 | ||
| Calibration 3 | 170,536 | ||
| ssj_ops@calibrated=170,000 | |||
| 100% | 99.3% | 170,000 | 168,866 |
| 90% | 89.7% | 153,000 | 152,534 |
| 80% | 80.0% | 136,000 | 135,917 |
| 70% | 69.9% | 119,000 | 118,871 |
| 60% | 60.1% | 102,000 | 102,166 |
| 50% | 50.2% | 85,000 | 85,320 |
| 40% | 40.5% | 68,000 | 68,903 |
| 30% | 30.2% | 51,000 | 51,390 |
| 20% | 19.9% | 34,000 | 33,836 |
| 10% | 9.8% | 17,000 | 16,742 |
| Active Idle | 0 | 0 | |
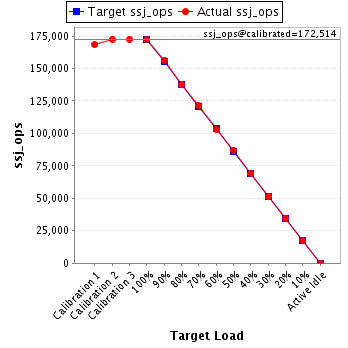
| Target Load | Actual Load | ssj_ops | |
|---|---|---|---|
| Target | Actual | ||
| Calibration 1 | 168,424 | ||
| Calibration 2 | 172,596 | ||
| Calibration 3 | 172,431 | ||
| ssj_ops@calibrated=172,514 | |||
| 100% | 99.9% | 172,514 | 172,356 |
| 90% | 90.6% | 155,262 | 156,331 |
| 80% | 80.0% | 138,011 | 137,927 |
| 70% | 70.2% | 120,760 | 121,163 |
| 60% | 59.9% | 103,508 | 103,330 |
| 50% | 50.5% | 86,257 | 87,068 |
| 40% | 40.1% | 69,005 | 69,169 |
| 30% | 29.8% | 51,754 | 51,329 |
| 20% | 20.0% | 34,503 | 34,423 |
| 10% | 9.9% | 17,251 | 17,153 |
| Active Idle | 0 | 0 | |
| Target Load | Actual Load | ssj_ops | |
|---|---|---|---|
| Target | Actual | ||
| Calibration 1 | 167,559 | ||
| Calibration 2 | 173,624 | ||
| Calibration 3 | 173,069 | ||
| ssj_ops@calibrated=173,346 | |||
| 100% | 99.2% | 173,346 | 172,021 |
| 90% | 90.4% | 156,012 | 156,665 |
| 80% | 80.5% | 138,677 | 139,582 |
| 70% | 70.4% | 121,342 | 121,976 |
| 60% | 59.6% | 104,008 | 103,307 |
| 50% | 50.1% | 86,673 | 86,832 |
| 40% | 39.8% | 69,339 | 69,043 |
| 30% | 30.1% | 52,004 | 52,138 |
| 20% | 20.0% | 34,669 | 34,717 |
| 10% | 10.2% | 17,335 | 17,608 |
| Active Idle | 0 | 0 | |

| Target Load | Actual Load | ssj_ops | |
|---|---|---|---|
| Target | Actual | ||
| Calibration 1 | 176,691 | ||
| Calibration 2 | 180,912 | ||
| Calibration 3 | 181,617 | ||
| ssj_ops@calibrated=181,264 | |||
| 100% | 99.4% | 181,264 | 180,267 |
| 90% | 90.3% | 163,138 | 163,685 |
| 80% | 79.1% | 145,011 | 143,442 |
| 70% | 70.0% | 126,885 | 126,833 |
| 60% | 60.7% | 108,759 | 110,090 |
| 50% | 49.8% | 90,632 | 90,346 |
| 40% | 40.4% | 72,506 | 73,209 |
| 30% | 30.0% | 54,379 | 54,396 |
| 20% | 20.0% | 36,253 | 36,288 |
| 10% | 10.1% | 18,126 | 18,220 |
| Active Idle | 0 | 0 | |

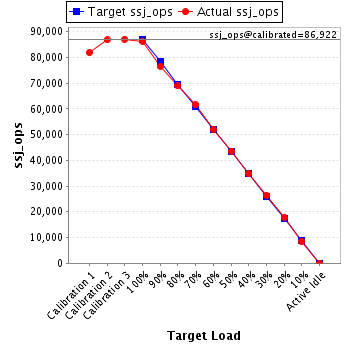
| Target Load | Actual Load | ssj_ops | |
|---|---|---|---|
| Target | Actual | ||
| Calibration 1 | 81,826 | ||
| Calibration 2 | 86,785 | ||
| Calibration 3 | 87,060 | ||
| ssj_ops@calibrated=86,922 | |||
| 100% | 99.3% | 86,922 | 86,319 |
| 90% | 87.9% | 78,230 | 76,423 |
| 80% | 79.2% | 69,538 | 68,875 |
| 70% | 70.8% | 60,846 | 61,531 |
| 60% | 59.8% | 52,153 | 51,992 |
| 50% | 50.1% | 43,461 | 43,576 |
| 40% | 40.1% | 34,769 | 34,850 |
| 30% | 30.3% | 26,077 | 26,333 |
| 20% | 20.5% | 17,384 | 17,790 |
| 10% | 9.9% | 8,692 | 8,587 |
| Active Idle | 0 | 0 | |
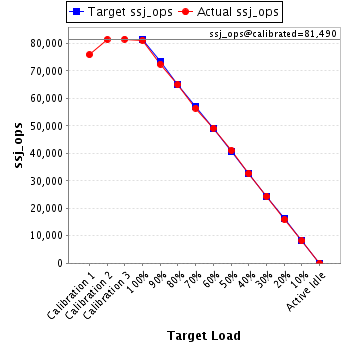
| Target Load | Actual Load | ssj_ops | |
|---|---|---|---|
| Target | Actual | ||
| Calibration 1 | 75,863 | ||
| Calibration 2 | 81,428 | ||
| Calibration 3 | 81,553 | ||
| ssj_ops@calibrated=81,490 | |||
| 100% | 99.6% | 81,490 | 81,141 |
| 90% | 88.9% | 73,341 | 72,480 |
| 80% | 79.7% | 65,192 | 64,959 |
| 70% | 69.3% | 57,043 | 56,459 |
| 60% | 60.3% | 48,894 | 49,165 |
| 50% | 50.4% | 40,745 | 41,079 |
| 40% | 40.1% | 32,596 | 32,647 |
| 30% | 29.9% | 24,447 | 24,379 |
| 20% | 19.5% | 16,298 | 15,925 |
| 10% | 10.1% | 8,149 | 8,204 |
| Active Idle | 0 | 0 | |