SPECpower_ssj2008
Aggregate Performance Report
Copyright © 2007-2017 Standard Performance Evaluation Corporation
| Quanta Computer Inc. QuantaGrid T42S-2U | ssj_ops@100% = 19,474,075 ssj_ops@100% per Host = 4,868,519 ssj_ops@100% per JVM = 1,217,130 |
||||
| Test Sponsor: | Quanta Computer Inc. | SPEC License #: | 9050 | Test Method: | Multi Node |
| Tested By: | Quanta Computer Inc. | Test Location: | Taoyuan, TW, R.O.C | Test Date: | Sep 26, 2017 |
| Hardware Availability: | Jul-2017 | Software Availability: | Sep-2016 | Publication: | Oct 25, 2017 |
| System Source: | Single Supplier | System Designation: | Server | Power Provisioning: | Line-powered |
| Target Load | Actual Load | ssj_ops | |
|---|---|---|---|
| Target | Actual | ||
| Calibration 1 | 19,727,932 | ||
| Calibration 2 | 19,541,827 | ||
| Calibration 3 | 19,554,437 | ||
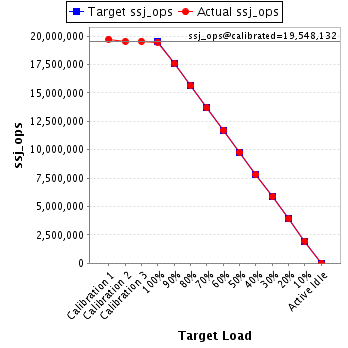
| ssj_ops@calibrated=19,548,132 | |||
| 100% | 99.6% | 19,548,132 | 19,474,075 |
| 90% | 90.0% | 17,593,319 | 17,601,667 |
| 80% | 79.9% | 15,638,506 | 15,622,423 |
| 70% | 69.9% | 13,683,693 | 13,670,579 |
| 60% | 60.0% | 11,728,879 | 11,724,542 |
| 50% | 50.0% | 9,774,066 | 9,779,247 |
| 40% | 40.0% | 7,819,253 | 7,819,267 |
| 30% | 30.0% | 5,864,440 | 5,864,207 |
| 20% | 20.0% | 3,909,626 | 3,911,119 |
| 10% | 10.0% | 1,954,813 | 1,957,457 |
| Active Idle | 0 | 0 | |
| # of Nodes | # of Chips | # of Cores | # of Threads | Total RAM (GB) | # of OS Images | # of JVM Instances |
|---|---|---|---|---|---|---|
| 4 | 8 | 224 | 448 | 768 | 4 | 16 |
| Set Identifier: | T42S-2U |
| Set Description: | System Under Test |
| # of Identical Nodes: | 4 |
| Comment: | None |
| Hardware per Node | |
|---|---|
| Hardware Vendor: | Quanta Computer Inc. |
| Model: | QuantaGrid T42S-2U |
| Form Factor: | 2U |
| CPU Name: | Intel Xeon Platinum 8176 |
| CPU Characteristics: | 28 core, 2.10GHz, 38.5MB L3 Cache |
| CPU Frequency (MHz): | 2100 |
| CPU(s) Enabled: | 56 cores, 2 chips, 28 cores/chip |
| Hardware Threads: | 112 (2 / core) |
| CPU(s) Orderable: | 1,2 chips |
| Primary Cache: | 32 KB I + 32 KB D on chip per core |
| Secondary Cache: | 1 MB I+D on chip per core |
| Tertiary Cache: | 39424 KB I+D on chip per chip |
| Other Cache: | None |
| Memory Amount (GB): | 192 |
| # and size of DIMM: | 12 x 16384 MB |
| Memory Details: | 16GB 2Rx8 PC4-2666V-RE1-12-PA0; slots A0, B0, C0, D0, E0, F0, populated for both Processor sockets |
| Power Supply Quantity and Rating (W): | 1 x 2200 |
| Power Supply Details: | None |
| Disk Drive: | 1 x 256G SATA SSD,Quanta P/N ABSAV256008 |
| Disk Controller: | Integrated SATA controller |
| # and type of Network Interface Cards (NICs) Installed: | 1 x dual-port Intel I357 Gigabit Ethernet controllerQuanta P/N 3GS5BMA00D0 |
| NICs Enabled in Firmware / OS / Connected: | 2/2/1 |
| Network Speed (Mbit): | 1000 |
| Keyboard: | None |
| Mouse: | None |
| Monitor: | None |
| Optical Drives: | No |
| Other Hardware: | None |
| Software per Node | |
|---|---|
| Power Management: | Balanced power plan in OS |
| Operating System (OS): | Windows Server 2012 R2 Datacenter |
| OS Version: | Version 6.3.9600 (Build 9600 |
| Filesystem: | NTFS |
| JVM Vendor: | Oracle Corporation |
| JVM Version: | Oracle HotSpot(TM) 64-Bit Server VM (build 24.80-b11, mixed mode), version 1.7.0_80 |
| JVM Command-line Options: | -server -Xmx13g -Xms13g -Xmn11g -XX:SurvivorRatio=1 -XX:TargetSurvivorRatio=99 -XX:ParallelGCThreads=24 -XX:AllocatePrefetchDistance=256 -XX:AllocatePrefetchLines=4 -XX:LoopUnrollLimit=45 -XX:InitialTenuringThreshold=12 -XX:MaxTenuringThreshold=15 -XX:InlineSmallCode=9000 -XX:MaxInlineSize=270 -XX:FreqInlineSize=6000 -XX:+UseLargePages -XX:+UseParallelOldGC -XX:+AggressiveOpts -XX:+OptimizeStringConcat -XX:+UseStringCache |
| JVM Affinity: | start /NODE [0,1,2,3] /AFFINITY [0xFFFFFFF] |
| JVM Instances: | 4 |
| JVM Initial Heap (MB): | 13000 |
| JVM Maximum Heap (MB): | 13000 |
| JVM Address Bits: | 64 |
| Boot Firmware Version: | 3A03E7 |
| Management Firmware Version: | 3.20 |
| Workload Version: | SSJ 1.2.10 |
| Director Location: | Controller |
| Other Software: | Specpower_ssj.props input.load_level.number_warehouses set to 112 due to a known inconsistency in processor reporting with this java version |
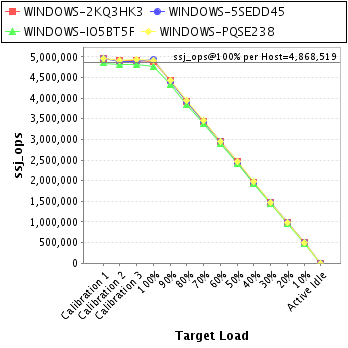
| Host | ssj_ops@100% |
|---|---|
| WINDOWS-2KQ3HK3 | 4,885,686 |
| WINDOWS-5SEDD45 | 4,924,712 |
| WINDOWS-IO5BT5F | 4,762,316 |
| WINDOWS-PQSE238 | 4,901,361 |
| ssj_ops@100% | 19,474,075 |
| ssj_ops@100% per Host | 4,868,519 |
| ssj_ops@100% per JVM | 1,217,130 |
| Target Load | Actual Load | ssj_ops | |
|---|---|---|---|
| Target | Actual | ||
| Calibration 1 | 4,968,208 | ||
| Calibration 2 | 4,908,781 | ||
| Calibration 3 | 4,905,385 | ||
| ssj_ops@calibrated=4,907,083 | |||
| 100% | 99.6% | 4,907,083 | 4,885,686 |
| 90% | 90.0% | 4,416,375 | 4,417,849 |
| 80% | 79.9% | 3,925,667 | 3,919,410 |
| 70% | 69.8% | 3,434,958 | 3,424,171 |
| 60% | 59.9% | 2,944,250 | 2,938,679 |
| 50% | 50.2% | 2,453,542 | 2,462,054 |
| 40% | 40.0% | 1,962,833 | 1,964,214 |
| 30% | 30.1% | 1,472,125 | 1,475,055 |
| 20% | 20.1% | 981,417 | 984,615 |
| 10% | 10.0% | 490,708 | 491,581 |
| Active Idle | 0 | 0 | |

| Target Load | Actual Load | ssj_ops | |
|---|---|---|---|
| Target | Actual | ||
| Calibration 1 | 4,952,989 | ||
| Calibration 2 | 4,895,032 | ||
| Calibration 3 | 4,899,457 | ||
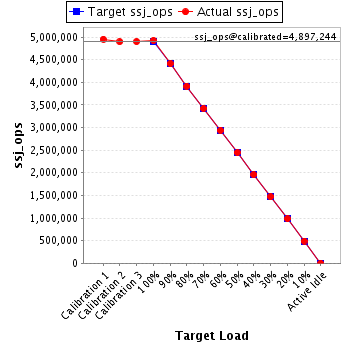
| ssj_ops@calibrated=4,897,244 | |||
| 100% | 100.6% | 4,897,244 | 4,924,712 |
| 90% | 90.1% | 4,407,520 | 4,411,148 |
| 80% | 80.0% | 3,917,796 | 3,916,392 |
| 70% | 69.9% | 3,428,071 | 3,424,136 |
| 60% | 60.0% | 2,938,347 | 2,940,221 |
| 50% | 49.9% | 2,448,622 | 2,445,141 |
| 40% | 40.0% | 1,958,898 | 1,957,258 |
| 30% | 30.0% | 1,469,173 | 1,466,785 |
| 20% | 20.0% | 979,449 | 981,621 |
| 10% | 10.0% | 489,724 | 491,594 |
| Active Idle | 0 | 0 | |
| Target Load | Actual Load | ssj_ops | |
|---|---|---|---|
| Target | Actual | ||
| Calibration 1 | 4,851,443 | ||
| Calibration 2 | 4,817,589 | ||
| Calibration 3 | 4,821,438 | ||
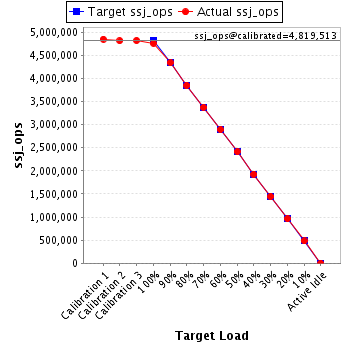
| ssj_ops@calibrated=4,819,513 | |||
| 100% | 98.8% | 4,819,513 | 4,762,316 |
| 90% | 90.1% | 4,337,562 | 4,342,362 |
| 80% | 79.9% | 3,855,611 | 3,850,064 |
| 70% | 70.0% | 3,373,659 | 3,374,967 |
| 60% | 60.0% | 2,891,708 | 2,893,063 |
| 50% | 50.1% | 2,409,757 | 2,413,674 |
| 40% | 40.0% | 1,927,805 | 1,927,041 |
| 30% | 30.0% | 1,445,854 | 1,444,203 |
| 20% | 19.9% | 963,903 | 961,098 |
| 10% | 10.0% | 481,951 | 482,009 |
| Active Idle | 0 | 0 | |
| Target Load | Actual Load | ssj_ops | |
|---|---|---|---|
| Target | Actual | ||
| Calibration 1 | 4,955,292 | ||
| Calibration 2 | 4,920,425 | ||
| Calibration 3 | 4,928,157 | ||
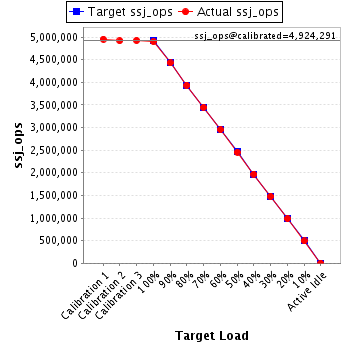
| ssj_ops@calibrated=4,924,291 | |||
| 100% | 99.5% | 4,924,291 | 4,901,361 |
| 90% | 90.0% | 4,431,862 | 4,430,307 |
| 80% | 79.9% | 3,939,433 | 3,936,558 |
| 70% | 70.0% | 3,447,004 | 3,447,304 |
| 60% | 60.0% | 2,954,575 | 2,952,578 |
| 50% | 49.9% | 2,462,146 | 2,458,378 |
| 40% | 40.0% | 1,969,716 | 1,970,752 |
| 30% | 30.0% | 1,477,287 | 1,478,163 |
| 20% | 20.0% | 984,858 | 983,786 |
| 10% | 10.0% | 492,429 | 492,274 |
| Active Idle | 0 | 0 | |