
SPECpower_ssj2008
Aggregate Performance Report
Copyright © 2007-2018 Standard Performance Evaluation Corporation
| Hewlett Packard Enterprise Synergy 480 Gen10 Compute Module | ssj_ops@100% = 68,782,048 ssj_ops@100% per Host = 5,731,837 ssj_ops@100% per JVM = 1,432,959 |
||||
| Test Sponsor: | Hewlett Packard Enterprise | SPEC License #: | 3 | Test Method: | Multi Node |
| Tested By: | Hewlett Packard Enterprise | Test Location: | Houston, TX, USA | Test Date: | Apr 6, 2018 |
| Hardware Availability: | Jun-2018 | Software Availability: | Mar-2018 | Publication: | Apr 25, 2018 |
| System Source: | Single Supplier | System Designation: | Server | Power Provisioning: | Line-powered |
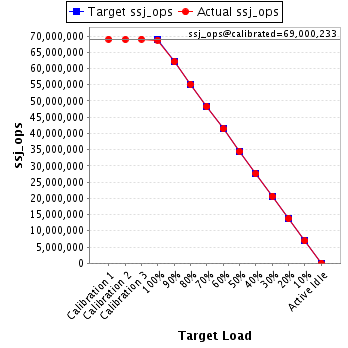
| Target Load | Actual Load | ssj_ops | |
|---|---|---|---|
| Target | Actual | ||
| Calibration 1 | 69,015,403 | ||
| Calibration 2 | 68,950,468 | ||
| Calibration 3 | 69,049,998 | ||
| ssj_ops@calibrated=69,000,233 | |||
| 100% | 99.7% | 69,000,233 | 68,782,048 |
| 90% | 90.1% | 62,100,210 | 62,142,573 |
| 80% | 79.9% | 55,200,186 | 55,147,007 |
| 70% | 70.0% | 48,300,163 | 48,270,941 |
| 60% | 60.0% | 41,400,140 | 41,397,135 |
| 50% | 50.0% | 34,500,117 | 34,483,600 |
| 40% | 40.0% | 27,600,093 | 27,582,779 |
| 30% | 30.0% | 20,700,070 | 20,699,871 |
| 20% | 20.0% | 13,800,047 | 13,793,172 |
| 10% | 10.0% | 6,900,023 | 6,902,852 |
| Active Idle | 0 | 0 | |
| # of Nodes | # of Chips | # of Cores | # of Threads | Total RAM (GB) | # of OS Images | # of JVM Instances |
|---|---|---|---|---|---|---|
| 12 | 24 | 672 | 1,344 | 2,304 | 12 | 48 |
| Set Identifier: | SUT |
| Set Description: | System Under Test |
| # of Identical Nodes: | 12 |
| Comment: | SUT |
| Hardware per Node | |
|---|---|
| Hardware Vendor: | Hewlett Packard Enterprise |
| Model: | Synergy 480 Gen10 Compute Module |
| Form Factor: | Other |
| CPU Name: | Intel Xeon Platinum 8180 2.50GHz |
| CPU Characteristics: | 28-Core, 2.50 GHz, 38.5 MB L3 Cache |
| CPU Frequency (MHz): | 2500 |
| CPU(s) Enabled: | 56 cores, 2 chips, 28 cores/chip |
| Hardware Threads: | 112 (2 / core) |
| CPU(s) Orderable: | 1,2 chips |
| Primary Cache: | 32 KB I + 32 KB D on chip per core |
| Secondary Cache: | 1 MB I+D on chip per core |
| Tertiary Cache: | 39424 KB I+D on chip per chip |
| Other Cache: | None |
| Memory Amount (GB): | 192 |
| # and size of DIMM: | 12 x 16384 MB |
| Memory Details: | 12 x 16GB 2Rx8 PC4-2666-V ECC; slots 1, 3, 5, 8, 10 and 12 populated on each CPU socket |
| Power Supply Quantity and Rating (W): | None |
| Power Supply Details: | Shared |
| Disk Drive: | 1 x HPE Synergy 480 Gen10 M.2 FIO Adapter Board Kit (873165-B21); 1 x HPE 480GB SATA 6G Read Intensive M.2 2280 SSD (875498-B21) |
| Disk Controller: | 1 x HPE Smart Array S100i SR Gen10 |
| # and type of Network Interface Cards (NICs) Installed: | 1 x HPE Synergy 3820C 10/20Gb 2-port Converged Network Adapter (777430-B21) |
| NICs Enabled in Firmware / OS / Connected: | 2/1/1 |
| Network Speed (Mbit): | 10000 |
| Keyboard: | None |
| Mouse: | None |
| Monitor: | None |
| Optical Drives: | No |
| Other Hardware: | None |
| Software per Node | |
|---|---|
| Power Management: | Enabled (see SUT Notes) |
| Operating System (OS): | Windows Server 2012 R2 Datacenter |
| OS Version: | 6.3 (Build 9600) |
| Filesystem: | NTFS |
| JVM Vendor: | Oracle Corporation |
| JVM Version: | Java HotSpot(TM) 64-Bit Server VM (build 24.80-b11, mixed mode), version 1.7.0_80 |
| JVM Command-line Options: | -server -Xmn19g -Xms21g -Xmx21g -XX:SurvivorRatio=1 -XX:TargetSurvivorRatio=99 -XX:ParallelGCThreads=28 -XX:AllocatePrefetchDistance=256 -XX:AllocatePrefetchLines=4 -XX:LoopUnrollLimit=45 -XX:InitialTenuringThreshold=12 -XX:MaxTenuringThreshold=15 -XX:InlineSmallCode=9000 -XX:MaxInlineSize=270 -XX:FreqInlineSize=6000 -XX:+UseLargePages -XX:+UseParallelOldGC -XX:+AggressiveOpts |
| JVM Affinity: | start /NODE [0,1,2,3] /AFFINITY [0xFFFFFFF] |
| JVM Instances: | 4 |
| JVM Initial Heap (MB): | 21000 |
| JVM Maximum Heap (MB): | 21000 |
| JVM Address Bits: | 64 |
| Boot Firmware Version: | I42 v1.32 (02/01/2018) |
| Management Firmware Version: | 1.15 Aug 17 2017 |
| Workload Version: | SSJ 1.2.10 |
| Director Location: | Controller |
| Other Software: | HPE Composer Version 3.10.07 (HPE OneView) with HPE Synergy Custom SPP Bundle 2017.10.20180323; Microsoft Windows KB4054519, KB4056898 |
| Host | ssj_ops@100% |
|---|---|
| NODE01 | 5,720,805 |
| NODE02 | 5,718,972 |
| NODE03 | 5,731,161 |
| NODE04 | 5,749,648 |
| NODE05 | 5,737,021 |
| NODE06 | 5,710,194 |
| NODE07 | 5,736,649 |
| NODE08 | 5,718,513 |
| NODE09 | 5,739,970 |
| NODE10 | 5,743,495 |
| NODE11 | 5,742,014 |
| NODE12 | 5,733,603 |
| ssj_ops@100% | 68,782,048 |
| ssj_ops@100% per Host | 5,731,837 |
| ssj_ops@100% per JVM | 1,432,959 |
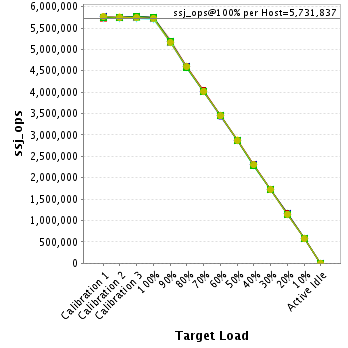
| Target Load | Actual Load | ssj_ops | |
|---|---|---|---|
| Target | Actual | ||
| Calibration 1 | 5,730,098 | ||
| Calibration 2 | 5,734,200 | ||
| Calibration 3 | 5,744,194 | ||
| ssj_ops@calibrated=5,739,197 | |||
| 100% | 99.7% | 5,739,197 | 5,720,805 |
| 90% | 90.0% | 5,165,277 | 5,167,078 |
| 80% | 79.9% | 4,591,357 | 4,585,267 |
| 70% | 70.0% | 4,017,438 | 4,018,131 |
| 60% | 60.1% | 3,443,518 | 3,447,686 |
| 50% | 49.8% | 2,869,598 | 2,860,472 |
| 40% | 40.0% | 2,295,679 | 2,296,017 |
| 30% | 30.0% | 1,721,759 | 1,720,289 |
| 20% | 20.0% | 1,147,839 | 1,150,637 |
| 10% | 10.0% | 573,920 | 574,937 |
| Active Idle | 0 | 0 | |

| Target Load | Actual Load | ssj_ops | |
|---|---|---|---|
| Target | Actual | ||
| Calibration 1 | 5,741,458 | ||
| Calibration 2 | 5,734,720 | ||
| Calibration 3 | 5,738,955 | ||
| ssj_ops@calibrated=5,736,838 | |||
| 100% | 99.7% | 5,736,838 | 5,718,972 |
| 90% | 90.1% | 5,163,154 | 5,167,148 |
| 80% | 79.9% | 4,589,470 | 4,585,342 |
| 70% | 69.8% | 4,015,786 | 4,004,035 |
| 60% | 60.0% | 3,442,103 | 3,442,578 |
| 50% | 50.0% | 2,868,419 | 2,869,189 |
| 40% | 40.0% | 2,294,735 | 2,294,359 |
| 30% | 30.0% | 1,721,051 | 1,723,146 |
| 20% | 20.0% | 1,147,368 | 1,145,008 |
| 10% | 10.0% | 573,684 | 573,153 |
| Active Idle | 0 | 0 | |

| Target Load | Actual Load | ssj_ops | |
|---|---|---|---|
| Target | Actual | ||
| Calibration 1 | 5,752,420 | ||
| Calibration 2 | 5,744,601 | ||
| Calibration 3 | 5,754,393 | ||
| ssj_ops@calibrated=5,749,497 | |||
| 100% | 99.7% | 5,749,497 | 5,731,161 |
| 90% | 89.9% | 5,174,548 | 5,170,896 |
| 80% | 80.1% | 4,599,598 | 4,602,905 |
| 70% | 70.0% | 4,024,648 | 4,023,414 |
| 60% | 60.0% | 3,449,698 | 3,446,947 |
| 50% | 50.0% | 2,874,749 | 2,873,112 |
| 40% | 39.9% | 2,299,799 | 2,293,932 |
| 30% | 30.0% | 1,724,849 | 1,727,563 |
| 20% | 20.0% | 1,149,899 | 1,152,238 |
| 10% | 10.0% | 574,950 | 576,231 |
| Active Idle | 0 | 0 | |

| Target Load | Actual Load | ssj_ops | |
|---|---|---|---|
| Target | Actual | ||
| Calibration 1 | 5,764,906 | ||
| Calibration 2 | 5,767,247 | ||
| Calibration 3 | 5,772,570 | ||
| ssj_ops@calibrated=5,769,909 | |||
| 100% | 99.6% | 5,769,909 | 5,749,648 |
| 90% | 90.0% | 5,192,918 | 5,192,683 |
| 80% | 79.8% | 4,615,927 | 4,606,072 |
| 70% | 70.0% | 4,038,936 | 4,040,386 |
| 60% | 60.0% | 3,461,945 | 3,461,572 |
| 50% | 50.0% | 2,884,954 | 2,884,743 |
| 40% | 40.0% | 2,307,963 | 2,305,969 |
| 30% | 30.0% | 1,730,973 | 1,729,043 |
| 20% | 20.0% | 1,153,982 | 1,154,260 |
| 10% | 10.0% | 576,991 | 576,995 |
| Active Idle | 0 | 0 | |

| Target Load | Actual Load | ssj_ops | |
|---|---|---|---|
| Target | Actual | ||
| Calibration 1 | 5,758,097 | ||
| Calibration 2 | 5,750,440 | ||
| Calibration 3 | 5,758,493 | ||
| ssj_ops@calibrated=5,754,467 | |||
| 100% | 99.7% | 5,754,467 | 5,737,021 |
| 90% | 90.0% | 5,179,020 | 5,178,974 |
| 80% | 79.9% | 4,603,573 | 4,598,285 |
| 70% | 70.0% | 4,028,127 | 4,029,628 |
| 60% | 60.1% | 3,452,680 | 3,455,576 |
| 50% | 50.0% | 2,877,233 | 2,875,047 |
| 40% | 39.9% | 2,301,787 | 2,298,421 |
| 30% | 29.9% | 1,726,340 | 1,719,851 |
| 20% | 19.9% | 1,150,893 | 1,147,797 |
| 10% | 10.0% | 575,447 | 573,807 |
| Active Idle | 0 | 0 | |

| Target Load | Actual Load | ssj_ops | |
|---|---|---|---|
| Target | Actual | ||
| Calibration 1 | 5,732,906 | ||
| Calibration 2 | 5,728,837 | ||
| Calibration 3 | 5,733,780 | ||
| ssj_ops@calibrated=5,731,308 | |||
| 100% | 99.6% | 5,731,308 | 5,710,194 |
| 90% | 90.0% | 5,158,177 | 5,156,599 |
| 80% | 80.0% | 4,585,047 | 4,585,404 |
| 70% | 69.9% | 4,011,916 | 4,007,973 |
| 60% | 60.1% | 3,438,785 | 3,443,239 |
| 50% | 49.9% | 2,865,654 | 2,862,787 |
| 40% | 40.0% | 2,292,523 | 2,290,348 |
| 30% | 30.0% | 1,719,392 | 1,719,395 |
| 20% | 20.0% | 1,146,262 | 1,145,989 |
| 10% | 10.0% | 573,131 | 573,329 |
| Active Idle | 0 | 0 | |

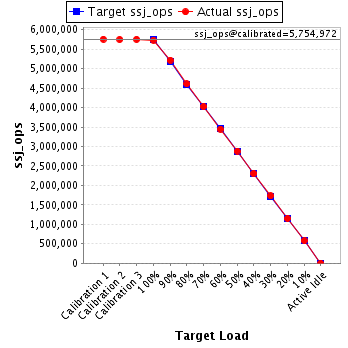
| Target Load | Actual Load | ssj_ops | |
|---|---|---|---|
| Target | Actual | ||
| Calibration 1 | 5,759,336 | ||
| Calibration 2 | 5,752,394 | ||
| Calibration 3 | 5,757,549 | ||
| ssj_ops@calibrated=5,754,972 | |||
| 100% | 99.7% | 5,754,972 | 5,736,649 |
| 90% | 90.7% | 5,179,475 | 5,221,261 |
| 80% | 80.1% | 4,603,977 | 4,609,410 |
| 70% | 70.0% | 4,028,480 | 4,027,330 |
| 60% | 60.0% | 3,452,983 | 3,450,448 |
| 50% | 50.1% | 2,877,486 | 2,883,743 |
| 40% | 40.1% | 2,301,989 | 2,305,018 |
| 30% | 30.0% | 1,726,492 | 1,729,265 |
| 20% | 20.0% | 1,150,994 | 1,150,427 |
| 10% | 10.0% | 575,497 | 578,116 |
| Active Idle | 0 | 0 | |
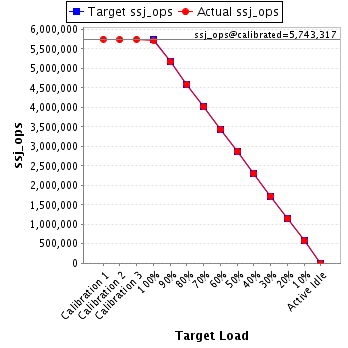
| Target Load | Actual Load | ssj_ops | |
|---|---|---|---|
| Target | Actual | ||
| Calibration 1 | 5,752,307 | ||
| Calibration 2 | 5,738,986 | ||
| Calibration 3 | 5,747,648 | ||
| ssj_ops@calibrated=5,743,317 | |||
| 100% | 99.6% | 5,743,317 | 5,718,513 |
| 90% | 90.0% | 5,168,986 | 5,168,014 |
| 80% | 79.9% | 4,594,654 | 4,591,493 |
| 70% | 69.9% | 4,020,322 | 4,014,878 |
| 60% | 60.0% | 3,445,990 | 3,444,515 |
| 50% | 50.0% | 2,871,659 | 2,873,930 |
| 40% | 40.1% | 2,297,327 | 2,301,296 |
| 30% | 30.0% | 1,722,995 | 1,725,095 |
| 20% | 19.9% | 1,148,663 | 1,143,972 |
| 10% | 10.0% | 574,332 | 573,833 |
| Active Idle | 0 | 0 | |
| Target Load | Actual Load | ssj_ops | |
|---|---|---|---|
| Target | Actual | ||
| Calibration 1 | 5,747,390 | ||
| Calibration 2 | 5,751,262 | ||
| Calibration 3 | 5,757,591 | ||
| ssj_ops@calibrated=5,754,427 | |||
| 100% | 99.7% | 5,754,427 | 5,739,970 |
| 90% | 90.1% | 5,178,984 | 5,185,860 |
| 80% | 79.9% | 4,603,541 | 4,597,370 |
| 70% | 70.0% | 4,028,099 | 4,030,259 |
| 60% | 60.0% | 3,452,656 | 3,454,658 |
| 50% | 49.9% | 2,877,213 | 2,872,691 |
| 40% | 39.9% | 2,301,771 | 2,297,989 |
| 30% | 30.0% | 1,726,328 | 1,724,932 |
| 20% | 20.0% | 1,150,885 | 1,152,136 |
| 10% | 10.0% | 575,443 | 576,728 |
| Active Idle | 0 | 0 | |

| Target Load | Actual Load | ssj_ops | |
|---|---|---|---|
| Target | Actual | ||
| Calibration 1 | 5,757,423 | ||
| Calibration 2 | 5,750,601 | ||
| Calibration 3 | 5,771,460 | ||
| ssj_ops@calibrated=5,761,030 | |||
| 100% | 99.7% | 5,761,030 | 5,743,495 |
| 90% | 90.0% | 5,184,927 | 5,184,733 |
| 80% | 79.9% | 4,608,824 | 4,603,204 |
| 70% | 69.9% | 4,032,721 | 4,025,401 |
| 60% | 59.9% | 3,456,618 | 3,452,139 |
| 50% | 50.0% | 2,880,515 | 2,879,244 |
| 40% | 40.0% | 2,304,412 | 2,303,950 |
| 30% | 30.0% | 1,728,309 | 1,726,614 |
| 20% | 20.0% | 1,152,206 | 1,154,751 |
| 10% | 10.0% | 576,103 | 576,976 |
| Active Idle | 0 | 0 | |

| Target Load | Actual Load | ssj_ops | |
|---|---|---|---|
| Target | Actual | ||
| Calibration 1 | 5,754,118 | ||
| Calibration 2 | 5,751,949 | ||
| Calibration 3 | 5,762,569 | ||
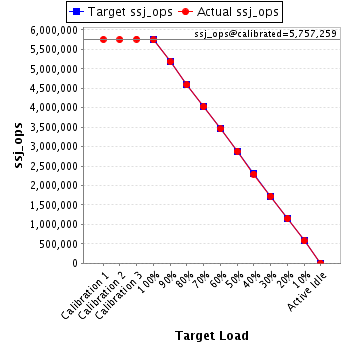
| ssj_ops@calibrated=5,757,259 | |||
| 100% | 99.7% | 5,757,259 | 5,742,014 |
| 90% | 90.0% | 5,181,533 | 5,182,933 |
| 80% | 79.7% | 4,605,807 | 4,586,965 |
| 70% | 69.9% | 4,030,081 | 4,026,009 |
| 60% | 60.0% | 3,454,356 | 3,453,730 |
| 50% | 50.0% | 2,878,630 | 2,879,005 |
| 40% | 39.9% | 2,302,904 | 2,294,643 |
| 30% | 30.0% | 1,727,178 | 1,726,683 |
| 20% | 19.9% | 1,151,452 | 1,147,537 |
| 10% | 10.0% | 575,726 | 575,163 |
| Active Idle | 0 | 0 | |
| Target Load | Actual Load | ssj_ops | |
|---|---|---|---|
| Target | Actual | ||
| Calibration 1 | 5,764,944 | ||
| Calibration 2 | 5,745,229 | ||
| Calibration 3 | 5,750,796 | ||
| ssj_ops@calibrated=5,748,012 | |||
| 100% | 99.7% | 5,748,012 | 5,733,603 |
| 90% | 89.9% | 5,173,211 | 5,166,394 |
| 80% | 79.9% | 4,598,410 | 4,595,288 |
| 70% | 70.0% | 4,023,609 | 4,023,497 |
| 60% | 59.9% | 3,448,807 | 3,444,047 |
| 50% | 49.9% | 2,874,006 | 2,869,637 |
| 40% | 40.0% | 2,299,205 | 2,300,837 |
| 30% | 30.1% | 1,724,404 | 1,727,995 |
| 20% | 20.0% | 1,149,602 | 1,148,421 |
| 10% | 10.0% | 574,801 | 573,584 |
| Active Idle | 0 | 0 | |
