SPECpower_ssj2008
Host 'Node02' Performance Report
Copyright © 2007-2018 Standard Performance Evaluation Corporation
| Hewlett Packard Enterprise Synergy 660 Gen10 Compute Module | ssj_ops@100% = 11,574,748 ssj_ops@100% per JVM = 1,446,843 |
||||
| Test Sponsor: | Hewlett Packard Enterprise | SPEC License #: | 3 | Test Method: | Multi Node |
| Tested By: | Hewlett Packard Enterprise | Test Location: | Houston, TX, USA | Test Date: | Apr 10, 2018 |
| Hardware Availability: | Jun-2018 | Software Availability: | Mar-2018 | Publication: | Apr 26, 2018 |
| System Source: | Single Supplier | System Designation: | Server | Power Provisioning: | Line-powered |
| Target Load | Actual Load | ssj_ops | |
|---|---|---|---|
| Target | Actual | ||
| Calibration 1 | 11,613,115 | ||
| Calibration 2 | 11,609,499 | ||
| Calibration 3 | 11,622,455 | ||
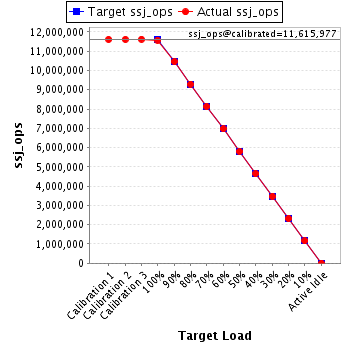
| ssj_ops@calibrated=11,615,977 | |||
| 100% | 99.6% | 11,615,977 | 11,574,748 |
| 90% | 90.0% | 10,454,379 | 10,458,769 |
| 80% | 80.0% | 9,292,782 | 9,296,257 |
| 70% | 70.0% | 8,131,184 | 8,130,686 |
| 60% | 60.0% | 6,969,586 | 6,972,425 |
| 50% | 50.0% | 5,807,989 | 5,805,122 |
| 40% | 40.0% | 4,646,391 | 4,645,538 |
| 30% | 29.9% | 3,484,793 | 3,474,412 |
| 20% | 20.0% | 2,323,195 | 2,320,704 |
| 10% | 10.0% | 1,161,598 | 1,158,902 |
| Active Idle | 0 | 0 | |
| Set Identifier: | SUT |
| Set Description: | System Under Test |
| # of Identical Nodes: | 6 |
| Comment: | SUT |
| Hardware | |
|---|---|
| Hardware Vendor: | Hewlett Packard Enterprise |
| Model: | Synergy 660 Gen10 Compute Module |
| Form Factor: | Other |
| CPU Name: | Intel Xeon Platinum 8180 2.50GHz |
| CPU Characteristics: | 28-Core, 2.50 GHz, 38.5MB L3 Cache |
| CPU Frequency (MHz): | 2500 |
| CPU(s) Enabled: | 112 cores, 4 chips, 28 cores/chip |
| Hardware Threads: | 224 (2 / core) |
| CPU(s) Orderable: | 1,2,3,4 chips |
| Primary Cache: | 32 KB I + 32 KB D on chip per core |
| Secondary Cache: | 1 MB I+D on chip per core |
| Tertiary Cache: | 39424 KB I+D on chip per chip |
| Other Cache: | None |
| Memory Amount (GB): | 384 |
| # and size of DIMM: | 24 x 16384 MB |
| Memory Details: | 24 x 16GB 2Rx8 PC4-2666-V ECC; slots 1, 3, 5, 8, 10 and 12 populated on each CPU socket |
| Power Supply Quantity and Rating (W): | None |
| Power Supply Details: | Shared |
| Disk Drive: | 1 x HPE 480GB SATA 6G Read Intensive M.2 (875319-B21) |
| Disk Controller: | 1 x HPE Smart Array S100i SR Gen10 |
| # and type of Network Interface Cards (NICs) Installed: | 1 x HPE Synergy 3820C 10/20Gb 2-port Converged Network Adapter (777430-B21) |
| NICs Enabled in Firmware / OS / Connected: | 2/1/1 |
| Network Speed (Mbit): | 10000 |
| Keyboard: | None |
| Mouse: | None |
| Monitor: | None |
| Optical Drives: | No |
| Other Hardware: | None |
| Software | |
|---|---|
| Power Management: | Enabled (see SUT Notes) |
| Operating System (OS): | Windows Server 2012 R2 Datacenter |
| OS Version: | Version 6.3 (Build 9600) |
| Filesystem: | NTFS |
| JVM Vendor: | Oracle Corporation |
| JVM Version: | Oracle Java HotSpot(TM) 64-Bit Server VM (build 24.80-b11, mixed mode), version 1.7.0_80 |
| JVM Command-line Options: | -server -Xmn19g -Xms21g -Xmx21g -XX:SurvivorRatio=1 -XX:TargetSurvivorRatio=99 -XX:AllocatePrefetchDistance=256 -XX:AllocatePrefetchLines=4 -XX:LoopUnrollLimit=30 -XX:InitialTenuringThreshold=12 -XX:MaxTenuringThreshold=15 -XX:ParallelGCThreads=28 -XX:InlineSmallCode=3900 -XX:MaxInlineSize=270 -XX:FreqInlineSize=2500 -XX:+AggressiveOpts -XX:+UseLargePages -XX:+UseParallelOldGC |
| JVM Affinity: | start /NODE [0,2,4,6] /AFFINITY [0x0000000FC0FF, 0xFC0FF0000000]; start /NODE [1,3,5,7] /AFFINITY [0x0000000FF03F,0xFF03F0000000] |
| JVM Instances: | 8 |
| JVM Initial Heap (MB): | 21000 |
| JVM Maximum Heap (MB): | 21000 |
| JVM Address Bits: | 64 |
| Boot Firmware Version: | I43 v1.32 (02/01/2018) |
| Management Firmware Version: | 1.15 August 17 2017 |
| Workload Version: | SSJ 1.2.10 |
| Director Location: | Controller |
| Other Software: | HPE Composer Version 3.10.07 (HPE OneView) with HPE Synergy Custom SPP Bundle 2017.10.20180323; Microsoft Windows KB4054519, KB4056898 |
| JVM Instance | ssj_ops@100% |
|---|---|
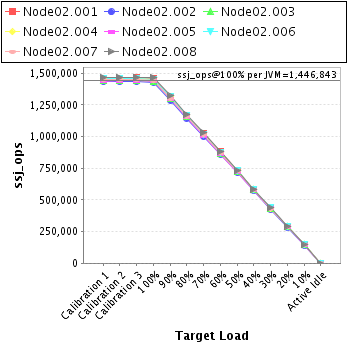
| Node02.001 | 1,458,953 |
| Node02.002 | 1,430,994 |
| Node02.003 | 1,433,872 |
| Node02.004 | 1,452,758 |
| Node02.005 | 1,436,931 |
| Node02.006 | 1,453,774 |
| Node02.007 | 1,441,720 |
| Node02.008 | 1,465,745 |
| ssj_ops@100% | 11,574,748 |
| ssj_ops@100% per JVM | 1,446,843 |
| Target Load | Actual Load | ssj_ops | |
|---|---|---|---|
| Target | Actual | ||
| Calibration 1 | 1,461,105 | ||
| Calibration 2 | 1,460,340 | ||
| Calibration 3 | 1,463,773 | ||
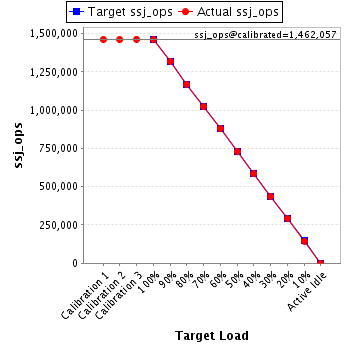
| ssj_ops@calibrated=1,462,057 | |||
| 100% | 99.8% | 1,462,057 | 1,458,953 |
| 90% | 90.2% | 1,315,851 | 1,319,083 |
| 80% | 80.0% | 1,169,645 | 1,169,141 |
| 70% | 69.9% | 1,023,440 | 1,021,312 |
| 60% | 60.1% | 877,234 | 879,094 |
| 50% | 49.9% | 731,028 | 729,447 |
| 40% | 39.9% | 584,823 | 583,556 |
| 30% | 29.9% | 438,617 | 437,746 |
| 20% | 20.0% | 292,411 | 292,496 |
| 10% | 9.9% | 146,206 | 145,360 |
| Active Idle | 0 | 0 | |
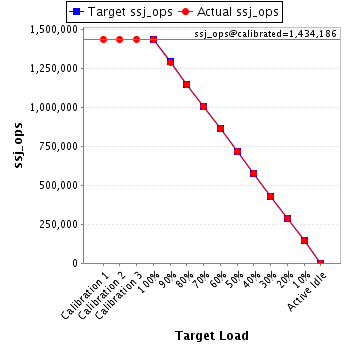
| Target Load | Actual Load | ssj_ops | |
|---|---|---|---|
| Target | Actual | ||
| Calibration 1 | 1,434,271 | ||
| Calibration 2 | 1,433,211 | ||
| Calibration 3 | 1,435,161 | ||
| ssj_ops@calibrated=1,434,186 | |||
| 100% | 99.8% | 1,434,186 | 1,430,994 |
| 90% | 89.8% | 1,290,767 | 1,287,234 |
| 80% | 79.8% | 1,147,348 | 1,145,170 |
| 70% | 69.9% | 1,003,930 | 1,002,001 |
| 60% | 60.2% | 860,511 | 862,699 |
| 50% | 50.1% | 717,093 | 718,100 |
| 40% | 40.2% | 573,674 | 577,026 |
| 30% | 29.9% | 430,256 | 428,276 |
| 20% | 20.0% | 286,837 | 286,321 |
| 10% | 10.0% | 143,419 | 143,493 |
| Active Idle | 0 | 0 | |
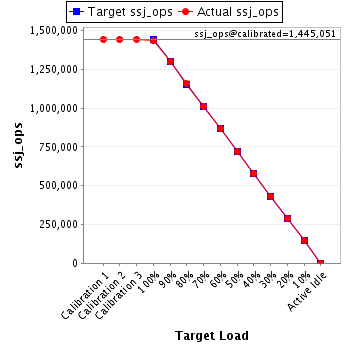
| Target Load | Actual Load | ssj_ops | |
|---|---|---|---|
| Target | Actual | ||
| Calibration 1 | 1,444,616 | ||
| Calibration 2 | 1,444,588 | ||
| Calibration 3 | 1,445,513 | ||
| ssj_ops@calibrated=1,445,051 | |||
| 100% | 99.2% | 1,445,051 | 1,433,872 |
| 90% | 90.0% | 1,300,546 | 1,299,876 |
| 80% | 80.1% | 1,156,040 | 1,157,158 |
| 70% | 70.1% | 1,011,535 | 1,013,401 |
| 60% | 60.1% | 867,030 | 868,679 |
| 50% | 50.0% | 722,525 | 721,854 |
| 40% | 40.0% | 578,020 | 578,730 |
| 30% | 30.0% | 433,515 | 433,043 |
| 20% | 20.1% | 289,010 | 290,049 |
| 10% | 10.1% | 144,505 | 145,400 |
| Active Idle | 0 | 0 | |
| Target Load | Actual Load | ssj_ops | |
|---|---|---|---|
| Target | Actual | ||
| Calibration 1 | 1,455,149 | ||
| Calibration 2 | 1,456,515 | ||
| Calibration 3 | 1,458,222 | ||
| ssj_ops@calibrated=1,457,368 | |||
| 100% | 99.7% | 1,457,368 | 1,452,758 |
| 90% | 90.3% | 1,311,632 | 1,315,395 |
| 80% | 80.0% | 1,165,895 | 1,166,201 |
| 70% | 69.9% | 1,020,158 | 1,019,044 |
| 60% | 60.2% | 874,421 | 876,829 |
| 50% | 50.1% | 728,684 | 729,700 |
| 40% | 40.0% | 582,947 | 582,231 |
| 30% | 29.9% | 437,211 | 436,334 |
| 20% | 20.0% | 291,474 | 292,002 |
| 10% | 9.9% | 145,737 | 144,223 |
| Active Idle | 0 | 0 | |

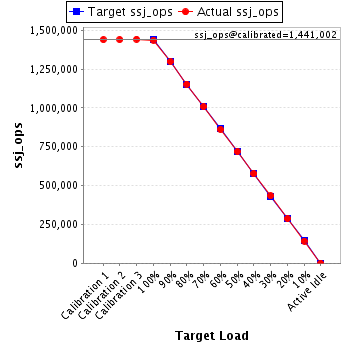
| Target Load | Actual Load | ssj_ops | |
|---|---|---|---|
| Target | Actual | ||
| Calibration 1 | 1,439,223 | ||
| Calibration 2 | 1,439,333 | ||
| Calibration 3 | 1,442,672 | ||
| ssj_ops@calibrated=1,441,002 | |||
| 100% | 99.7% | 1,441,002 | 1,436,931 |
| 90% | 90.1% | 1,296,902 | 1,298,170 |
| 80% | 80.0% | 1,152,802 | 1,153,323 |
| 70% | 70.0% | 1,008,702 | 1,008,318 |
| 60% | 59.8% | 864,601 | 861,953 |
| 50% | 49.9% | 720,501 | 718,918 |
| 40% | 40.0% | 576,401 | 576,308 |
| 30% | 30.1% | 432,301 | 433,326 |
| 20% | 19.9% | 288,200 | 286,674 |
| 10% | 9.9% | 144,100 | 143,245 |
| Active Idle | 0 | 0 | |
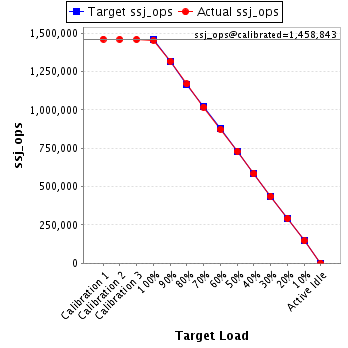
| Target Load | Actual Load | ssj_ops | |
|---|---|---|---|
| Target | Actual | ||
| Calibration 1 | 1,460,800 | ||
| Calibration 2 | 1,459,208 | ||
| Calibration 3 | 1,458,479 | ||
| ssj_ops@calibrated=1,458,843 | |||
| 100% | 99.7% | 1,458,843 | 1,453,774 |
| 90% | 90.3% | 1,312,959 | 1,317,076 |
| 80% | 80.1% | 1,167,075 | 1,168,913 |
| 70% | 69.8% | 1,021,190 | 1,018,460 |
| 60% | 59.9% | 875,306 | 873,309 |
| 50% | 50.0% | 729,422 | 729,337 |
| 40% | 39.9% | 583,537 | 582,754 |
| 30% | 29.9% | 437,653 | 436,822 |
| 20% | 20.0% | 291,769 | 292,092 |
| 10% | 10.0% | 145,884 | 146,603 |
| Active Idle | 0 | 0 | |
| Target Load | Actual Load | ssj_ops | |
|---|---|---|---|
| Target | Actual | ||
| Calibration 1 | 1,450,523 | ||
| Calibration 2 | 1,447,196 | ||
| Calibration 3 | 1,449,337 | ||
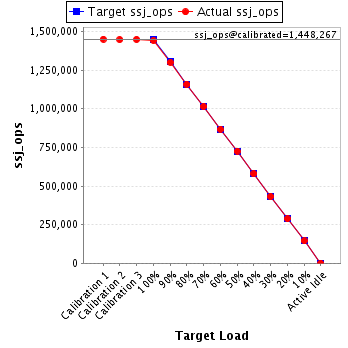
| ssj_ops@calibrated=1,448,267 | |||
| 100% | 99.5% | 1,448,267 | 1,441,720 |
| 90% | 89.8% | 1,303,440 | 1,300,245 |
| 80% | 80.0% | 1,158,613 | 1,158,461 |
| 70% | 70.1% | 1,013,787 | 1,015,151 |
| 60% | 59.9% | 868,960 | 867,887 |
| 50% | 50.1% | 724,133 | 725,652 |
| 40% | 40.0% | 579,307 | 578,610 |
| 30% | 29.8% | 434,480 | 431,326 |
| 20% | 19.8% | 289,653 | 287,312 |
| 10% | 10.0% | 144,827 | 144,634 |
| Active Idle | 0 | 0 | |
| Target Load | Actual Load | ssj_ops | |
|---|---|---|---|
| Target | Actual | ||
| Calibration 1 | 1,467,427 | ||
| Calibration 2 | 1,469,109 | ||
| Calibration 3 | 1,469,298 | ||
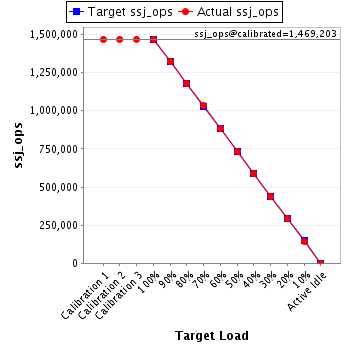
| ssj_ops@calibrated=1,469,203 | |||
| 100% | 99.8% | 1,469,203 | 1,465,745 |
| 90% | 90.0% | 1,322,283 | 1,321,691 |
| 80% | 80.2% | 1,175,363 | 1,177,889 |
| 70% | 70.3% | 1,028,442 | 1,032,999 |
| 60% | 60.0% | 881,522 | 881,974 |
| 50% | 49.8% | 734,602 | 732,113 |
| 40% | 39.9% | 587,681 | 586,323 |
| 30% | 29.8% | 440,761 | 437,540 |
| 20% | 20.0% | 293,841 | 293,759 |
| 10% | 9.9% | 146,920 | 145,945 |
| Active Idle | 0 | 0 | |