SPECpower_ssj2008
Aggregate Performance Report
Copyright © 2007-2018 Standard Performance Evaluation Corporation
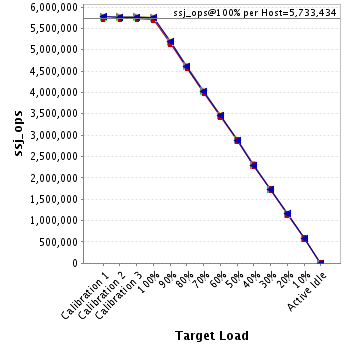
| Hewlett Packard Enterprise Synergy 480 Gen10 Compute Module | ssj_ops@100% = 57,334,339 ssj_ops@100% per Host = 5,733,434 ssj_ops@100% per JVM = 1,433,358 |
||||
| Test Sponsor: | Hewlett Packard Enterprise | SPEC License #: | 3 | Test Method: | Multi Node |
| Tested By: | Hewlett Packard Enterprise | Test Location: | Houston, TX, USA | Test Date: | Aug 24, 2018 |
| Hardware Availability: | Jun-2018 | Software Availability: | Mar-2018 | Publication: | Sep 12, 2018 |
| System Source: | Single Supplier | System Designation: | Server | Power Provisioning: | Line-powered |
| Target Load | Actual Load | ssj_ops | |
|---|---|---|---|
| Target | Actual | ||
| Calibration 1 | 57,485,158 | ||
| Calibration 2 | 57,428,536 | ||
| Calibration 3 | 57,521,235 | ||
| ssj_ops@calibrated=57,474,885 | |||
| 100% | 99.8% | 57,474,885 | 57,334,339 |
| 90% | 90.0% | 51,727,397 | 51,730,277 |
| 80% | 80.0% | 45,979,908 | 45,985,923 |
| 70% | 70.0% | 40,232,420 | 40,224,645 |
| 60% | 60.0% | 34,484,931 | 34,480,877 |
| 50% | 50.0% | 28,737,443 | 28,747,796 |
| 40% | 40.0% | 22,989,954 | 22,994,376 |
| 30% | 30.0% | 17,242,466 | 17,247,527 |
| 20% | 20.0% | 11,494,977 | 11,480,734 |
| 10% | 10.0% | 5,747,489 | 5,750,312 |
| Active Idle | 0 | 0 | |

| # of Nodes | # of Chips | # of Cores | # of Threads | Total RAM (GB) | # of OS Images | # of JVM Instances |
|---|---|---|---|---|---|---|
| 10 | 20 | 560 | 1,120 | 1,920 | 10 | 40 |
| Set Identifier: | SUT |
| Set Description: | System Under Test |
| # of Identical Nodes: | 10 |
| Comment: | SUT |
| Hardware per Node | |
|---|---|
| Hardware Vendor: | Hewlett Packard Enterprise |
| Model: | Synergy 480 Gen10 Compute Module |
| Form Factor: | Other |
| CPU Name: | Intel Xeon Platinum 8180 2.50GHz |
| CPU Characteristics: | 28-Core, 2.50 GHz, 38.5 MB L3 Cache |
| CPU Frequency (MHz): | 2500 |
| CPU(s) Enabled: | 56 cores, 2 chips, 28 cores/chip |
| Hardware Threads: | 112 (2 / core) |
| CPU(s) Orderable: | 1,2 chips |
| Primary Cache: | 32 KB I + 32 KB D on chip per core |
| Secondary Cache: | 1 MB I+D on chip per core |
| Tertiary Cache: | 39424 KB I+D on chip per chip |
| Other Cache: | None |
| Memory Amount (GB): | 192 |
| # and size of DIMM: | 12 x 16384 MB |
| Memory Details: | 12 x 16GB 2Rx8 PC4-2666-V ECC; slots 1, 3, 5, 8, 10 and 12 populated on each CPU socket |
| Power Supply Quantity and Rating (W): | None |
| Power Supply Details: | Shared |
| Disk Drive: | 1 x HPE Synergy 480 Gen10 M.2 FIO Adapter Board Kit (873165-B21); 1 x HPE 480GB SATA 6G Read Intensive M.2 2280 SSD (875498-B21) |
| Disk Controller: | 1 x HPE Smart Array S100i SR Gen10 |
| # and type of Network Interface Cards (NICs) Installed: | 1 x HPE Synergy 3820C 10/20Gb 2-port Converged Network Adapter (777430-B21) |
| NICs Enabled in Firmware / OS / Connected: | 2/1/1 |
| Network Speed (Mbit): | 10000 |
| Keyboard: | None |
| Mouse: | None |
| Monitor: | None |
| Optical Drives: | No |
| Other Hardware: | None |
| Software per Node | |
|---|---|
| Power Management: | Enabled (see SUT Notes) |
| Operating System (OS): | Windows Server 2012 R2 Datacenter |
| OS Version: | 6.3 (Build 9600) |
| Filesystem: | NTFS |
| JVM Vendor: | Oracle Corporation |
| JVM Version: | Java HotSpot(TM) 64-Bit Server VM (build 24.80-b11, mixed mode), version 1.7.0_80 |
| JVM Command-line Options: | -server -Xmn19g -Xms21g -Xmx21g -XX:SurvivorRatio=1 -XX:TargetSurvivorRatio=99 -XX:ParallelGCThreads=28 -XX:AllocatePrefetchDistance=256 -XX:AllocatePrefetchLines=4 -XX:LoopUnrollLimit=45 -XX:InitialTenuringThreshold=12 -XX:MaxTenuringThreshold=15 -XX:InlineSmallCode=9000 -XX:MaxInlineSize=270 -XX:FreqInlineSize=6000 -XX:+UseLargePages -XX:+UseParallelOldGC -XX:+AggressiveOpts |
| JVM Affinity: | start /NODE [0,1,2,3] /AFFINITY [0xFFFFFFF] |
| JVM Instances: | 4 |
| JVM Initial Heap (MB): | 21000 |
| JVM Maximum Heap (MB): | 21000 |
| JVM Address Bits: | 64 |
| Boot Firmware Version: | I42 v1.32 (02/01/2018) |
| Management Firmware Version: | 1.15 Aug 17 2017 |
| Workload Version: | SSJ 1.2.10 |
| Director Location: | Controller |
| Other Software: | HPE Composer Version 3.10.07 (HPE OneView) with HPE Synergy Custom SPP Bundle 2017.10.20180323; Microsoft Windows KB4054519, KB4056898 |
| Host | ssj_ops@100% |
|---|---|
| NODE01 | 5,735,419 |
| NODE02 | 5,728,244 |
| NODE03 | 5,734,170 |
| NODE04 | 5,745,064 |
| NODE05 | 5,731,394 |
| NODE06 | 5,713,060 |
| NODE07 | 5,718,495 |
| NODE08 | 5,766,425 |
| NODE09 | 5,714,631 |
| NODE10 | 5,747,438 |
| ssj_ops@100% | 57,334,339 |
| ssj_ops@100% per Host | 5,733,434 |
| ssj_ops@100% per JVM | 1,433,358 |
| Target Load | Actual Load | ssj_ops | |
|---|---|---|---|
| Target | Actual | ||
| Calibration 1 | 5,757,011 | ||
| Calibration 2 | 5,749,653 | ||
| Calibration 3 | 5,756,018 | ||
| ssj_ops@calibrated=5,752,836 | |||
| 100% | 99.7% | 5,752,836 | 5,735,419 |
| 90% | 89.9% | 5,177,552 | 5,170,442 |
| 80% | 80.0% | 4,602,268 | 4,601,878 |
| 70% | 70.0% | 4,026,985 | 4,027,126 |
| 60% | 60.0% | 3,451,701 | 3,453,848 |
| 50% | 50.0% | 2,876,418 | 2,877,791 |
| 40% | 40.0% | 2,301,134 | 2,299,592 |
| 30% | 30.0% | 1,725,851 | 1,727,140 |
| 20% | 20.0% | 1,150,567 | 1,149,094 |
| 10% | 10.0% | 575,284 | 575,639 |
| Active Idle | 0 | 0 | |
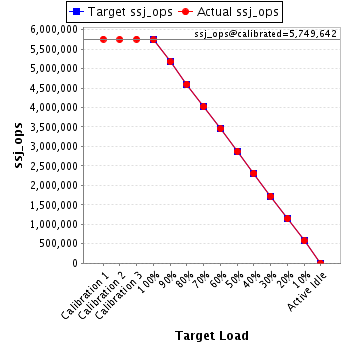
| Target Load | Actual Load | ssj_ops | |
|---|---|---|---|
| Target | Actual | ||
| Calibration 1 | 5,742,794 | ||
| Calibration 2 | 5,740,402 | ||
| Calibration 3 | 5,754,760 | ||
| ssj_ops@calibrated=5,747,581 | |||
| 100% | 99.7% | 5,747,581 | 5,728,244 |
| 90% | 90.1% | 5,172,823 | 5,175,749 |
| 80% | 80.0% | 4,598,065 | 4,597,526 |
| 70% | 70.0% | 4,023,307 | 4,022,776 |
| 60% | 59.9% | 3,448,549 | 3,444,575 |
| 50% | 50.1% | 2,873,790 | 2,877,578 |
| 40% | 40.1% | 2,299,032 | 2,302,305 |
| 30% | 29.9% | 1,724,274 | 1,721,258 |
| 20% | 19.9% | 1,149,516 | 1,146,545 |
| 10% | 10.0% | 574,758 | 573,925 |
| Active Idle | 0 | 0 | |

| Target Load | Actual Load | ssj_ops | |
|---|---|---|---|
| Target | Actual | ||
| Calibration 1 | 5,754,123 | ||
| Calibration 2 | 5,745,141 | ||
| Calibration 3 | 5,754,144 | ||
| ssj_ops@calibrated=5,749,642 | |||
| 100% | 99.7% | 5,749,642 | 5,734,170 |
| 90% | 90.0% | 5,174,678 | 5,175,267 |
| 80% | 79.9% | 4,599,714 | 4,595,739 |
| 70% | 69.9% | 4,024,750 | 4,021,607 |
| 60% | 60.0% | 3,449,785 | 3,451,028 |
| 50% | 50.0% | 2,874,821 | 2,872,800 |
| 40% | 40.1% | 2,299,857 | 2,307,468 |
| 30% | 30.0% | 1,724,893 | 1,726,405 |
| 20% | 19.9% | 1,149,928 | 1,146,836 |
| 10% | 10.1% | 574,964 | 578,320 |
| Active Idle | 0 | 0 | |
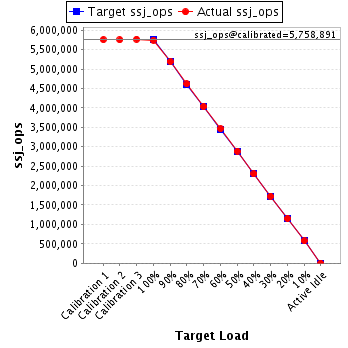
| Target Load | Actual Load | ssj_ops | |
|---|---|---|---|
| Target | Actual | ||
| Calibration 1 | 5,753,320 | ||
| Calibration 2 | 5,749,535 | ||
| Calibration 3 | 5,768,248 | ||
| ssj_ops@calibrated=5,758,891 | |||
| 100% | 99.8% | 5,758,891 | 5,745,064 |
| 90% | 90.1% | 5,183,002 | 5,190,677 |
| 80% | 80.2% | 4,607,113 | 4,618,012 |
| 70% | 70.1% | 4,031,224 | 4,034,810 |
| 60% | 60.1% | 3,455,335 | 3,463,299 |
| 50% | 50.1% | 2,879,446 | 2,887,573 |
| 40% | 39.9% | 2,303,556 | 2,298,462 |
| 30% | 30.0% | 1,727,667 | 1,726,810 |
| 20% | 20.0% | 1,151,778 | 1,148,997 |
| 10% | 10.0% | 575,889 | 577,218 |
| Active Idle | 0 | 0 | |
| Target Load | Actual Load | ssj_ops | |
|---|---|---|---|
| Target | Actual | ||
| Calibration 1 | 5,737,863 | ||
| Calibration 2 | 5,738,401 | ||
| Calibration 3 | 5,743,048 | ||
| ssj_ops@calibrated=5,740,725 | |||
| 100% | 99.8% | 5,740,725 | 5,731,394 |
| 90% | 90.1% | 5,166,652 | 5,171,231 |
| 80% | 80.0% | 4,592,580 | 4,591,275 |
| 70% | 70.1% | 4,018,507 | 4,021,528 |
| 60% | 59.8% | 3,444,435 | 3,434,061 |
| 50% | 50.0% | 2,870,362 | 2,869,560 |
| 40% | 40.1% | 2,296,290 | 2,302,033 |
| 30% | 30.0% | 1,722,217 | 1,722,595 |
| 20% | 19.9% | 1,148,145 | 1,145,267 |
| 10% | 10.0% | 574,072 | 573,653 |
| Active Idle | 0 | 0 | |

| Target Load | Actual Load | ssj_ops | |
|---|---|---|---|
| Target | Actual | ||
| Calibration 1 | 5,735,694 | ||
| Calibration 2 | 5,724,905 | ||
| Calibration 3 | 5,730,211 | ||
| ssj_ops@calibrated=5,727,558 | |||
| 100% | 99.7% | 5,727,558 | 5,713,060 |
| 90% | 89.9% | 5,154,802 | 5,146,830 |
| 80% | 80.0% | 4,582,046 | 4,581,740 |
| 70% | 70.0% | 4,009,290 | 4,006,825 |
| 60% | 60.0% | 3,436,535 | 3,438,056 |
| 50% | 50.0% | 2,863,779 | 2,866,177 |
| 40% | 40.1% | 2,291,023 | 2,296,777 |
| 30% | 30.1% | 1,718,267 | 1,721,829 |
| 20% | 20.0% | 1,145,512 | 1,144,484 |
| 10% | 10.0% | 572,756 | 573,070 |
| Active Idle | 0 | 0 | |

| Target Load | Actual Load | ssj_ops | |
|---|---|---|---|
| Target | Actual | ||
| Calibration 1 | 5,730,655 | ||
| Calibration 2 | 5,723,881 | ||
| Calibration 3 | 5,736,472 | ||
| ssj_ops@calibrated=5,730,177 | |||
| 100% | 99.8% | 5,730,177 | 5,718,495 |
| 90% | 90.0% | 5,157,159 | 5,155,751 |
| 80% | 79.9% | 4,584,141 | 4,580,698 |
| 70% | 70.0% | 4,011,124 | 4,009,537 |
| 60% | 60.1% | 3,438,106 | 3,441,740 |
| 50% | 50.0% | 2,865,088 | 2,862,810 |
| 40% | 40.0% | 2,292,071 | 2,293,120 |
| 30% | 30.0% | 1,719,053 | 1,717,367 |
| 20% | 19.9% | 1,146,035 | 1,140,857 |
| 10% | 10.0% | 573,018 | 573,252 |
| Active Idle | 0 | 0 | |

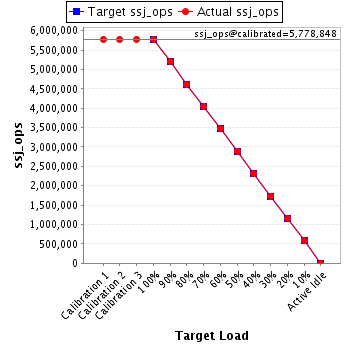
| Target Load | Actual Load | ssj_ops | |
|---|---|---|---|
| Target | Actual | ||
| Calibration 1 | 5,776,663 | ||
| Calibration 2 | 5,775,840 | ||
| Calibration 3 | 5,781,857 | ||
| ssj_ops@calibrated=5,778,848 | |||
| 100% | 99.8% | 5,778,848 | 5,766,425 |
| 90% | 90.0% | 5,200,964 | 5,201,462 |
| 80% | 80.0% | 4,623,079 | 4,622,433 |
| 70% | 69.9% | 4,045,194 | 4,041,284 |
| 60% | 60.0% | 3,467,309 | 3,469,620 |
| 50% | 50.1% | 2,889,424 | 2,892,521 |
| 40% | 39.9% | 2,311,539 | 2,303,484 |
| 30% | 30.0% | 1,733,655 | 1,733,210 |
| 20% | 20.0% | 1,155,770 | 1,156,980 |
| 10% | 10.0% | 577,885 | 578,967 |
| Active Idle | 0 | 0 | |
| Target Load | Actual Load | ssj_ops | |
|---|---|---|---|
| Target | Actual | ||
| Calibration 1 | 5,726,115 | ||
| Calibration 2 | 5,722,668 | ||
| Calibration 3 | 5,731,467 | ||
| ssj_ops@calibrated=5,727,068 | |||
| 100% | 99.8% | 5,727,068 | 5,714,631 |
| 90% | 90.0% | 5,154,361 | 5,154,839 |
| 80% | 80.1% | 4,581,654 | 4,587,106 |
| 70% | 70.0% | 4,008,948 | 4,008,649 |
| 60% | 59.9% | 3,436,241 | 3,429,352 |
| 50% | 50.0% | 2,863,534 | 2,864,802 |
| 40% | 40.0% | 2,290,827 | 2,293,549 |
| 30% | 30.0% | 1,718,120 | 1,720,637 |
| 20% | 20.0% | 1,145,414 | 1,147,813 |
| 10% | 10.0% | 572,707 | 570,376 |
| Active Idle | 0 | 0 | |

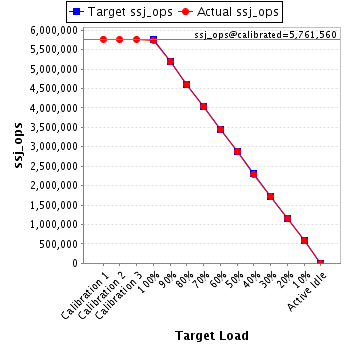
| Target Load | Actual Load | ssj_ops | |
|---|---|---|---|
| Target | Actual | ||
| Calibration 1 | 5,770,918 | ||
| Calibration 2 | 5,758,110 | ||
| Calibration 3 | 5,765,011 | ||
| ssj_ops@calibrated=5,761,560 | |||
| 100% | 99.8% | 5,761,560 | 5,747,438 |
| 90% | 90.0% | 5,185,404 | 5,188,027 |
| 80% | 80.0% | 4,609,248 | 4,609,517 |
| 70% | 70.0% | 4,033,092 | 4,030,502 |
| 60% | 60.0% | 3,456,936 | 3,455,300 |
| 50% | 49.9% | 2,880,780 | 2,876,184 |
| 40% | 39.9% | 2,304,624 | 2,297,587 |
| 30% | 30.0% | 1,728,468 | 1,730,276 |
| 20% | 20.0% | 1,152,312 | 1,153,863 |
| 10% | 10.0% | 576,156 | 575,891 |
| Active Idle | 0 | 0 | |