SPECpower_ssj2008
Host 'NODE01' Performance Report
Copyright © 2007-2018 Standard Performance Evaluation Corporation
| Hewlett Packard Enterprise Synergy 480 Gen10 Compute Module | ssj_ops@100% = 5,744,003 ssj_ops@100% per JVM = 1,436,001 |
||||
| Test Sponsor: | Hewlett Packard Enterprise | SPEC License #: | 3 | Test Method: | Multi Node |
| Tested By: | Hewlett Packard Enterprise | Test Location: | Houston, TX, USA | Test Date: | Aug 26, 2018 |
| Hardware Availability: | Jun-2018 | Software Availability: | Mar-2018 | Publication: | Sep 12, 2018 |
| System Source: | Single Supplier | System Designation: | Server | Power Provisioning: | Line-powered |
| Target Load | Actual Load | ssj_ops | |
|---|---|---|---|
| Target | Actual | ||
| Calibration 1 | 5,779,241 | ||
| Calibration 2 | 5,754,757 | ||
| Calibration 3 | 5,772,483 | ||
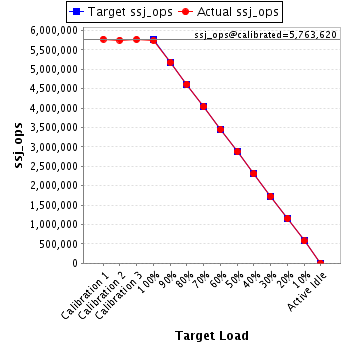
| ssj_ops@calibrated=5,763,620 | |||
| 100% | 99.7% | 5,763,620 | 5,744,003 |
| 90% | 90.0% | 5,187,258 | 5,185,363 |
| 80% | 80.1% | 4,610,896 | 4,617,409 |
| 70% | 70.1% | 4,034,534 | 4,040,761 |
| 60% | 59.9% | 3,458,172 | 3,453,529 |
| 50% | 49.9% | 2,881,810 | 2,878,750 |
| 40% | 40.0% | 2,305,448 | 2,306,559 |
| 30% | 30.0% | 1,729,086 | 1,729,839 |
| 20% | 20.1% | 1,152,724 | 1,158,305 |
| 10% | 10.0% | 576,362 | 574,990 |
| Active Idle | 0 | 0 | |
| Set Identifier: | SUT |
| Set Description: | System Under Test |
| # of Identical Nodes: | 7 |
| Comment: | SUT |
| Hardware | |
|---|---|
| Hardware Vendor: | Hewlett Packard Enterprise |
| Model: | Synergy 480 Gen10 Compute Module |
| Form Factor: | Other |
| CPU Name: | Intel Xeon Platinum 8180 2.50GHz |
| CPU Characteristics: | 28-Core, 2.50 GHz, 38.5 MB L3 Cache |
| CPU Frequency (MHz): | 2500 |
| CPU(s) Enabled: | 56 cores, 2 chips, 28 cores/chip |
| Hardware Threads: | 112 (2 / core) |
| CPU(s) Orderable: | 1,2 chips |
| Primary Cache: | 32 KB I + 32 KB D on chip per core |
| Secondary Cache: | 1 MB I+D on chip per core |
| Tertiary Cache: | 39424 KB I+D on chip per chip |
| Other Cache: | None |
| Memory Amount (GB): | 192 |
| # and size of DIMM: | 12 x 16384 MB |
| Memory Details: | 12 x 16GB 2Rx8 PC4-2666-V ECC; slots 1, 3, 5, 8, 10 and 12 populated on each CPU socket |
| Power Supply Quantity and Rating (W): | None |
| Power Supply Details: | Shared |
| Disk Drive: | 1 x HPE Synergy 480 Gen10 M.2 FIO Adapter Board Kit (873165-B21); 1 x HPE 480GB SATA 6G Read Intensive M.2 2280 SSD (875498-B21) |
| Disk Controller: | 1 x HPE Smart Array S100i SR Gen10 |
| # and type of Network Interface Cards (NICs) Installed: | 1 x HPE Synergy 3820C 10/20Gb 2-port Converged Network Adapter (777430-B21) |
| NICs Enabled in Firmware / OS / Connected: | 2/1/1 |
| Network Speed (Mbit): | 10000 |
| Keyboard: | None |
| Mouse: | None |
| Monitor: | None |
| Optical Drives: | No |
| Other Hardware: | None |
| Software | |
|---|---|
| Power Management: | Enabled (see SUT Notes) |
| Operating System (OS): | Windows Server 2012 R2 Datacenter |
| OS Version: | 6.3 (Build 9600) |
| Filesystem: | NTFS |
| JVM Vendor: | Oracle Corporation |
| JVM Version: | Java HotSpot(TM) 64-Bit Server VM (build 24.80-b11, mixed mode), version 1.7.0_80 |
| JVM Command-line Options: | -server -Xmn19g -Xms21g -Xmx21g -XX:SurvivorRatio=1 -XX:TargetSurvivorRatio=99 -XX:ParallelGCThreads=28 -XX:AllocatePrefetchDistance=256 -XX:AllocatePrefetchLines=4 -XX:LoopUnrollLimit=45 -XX:InitialTenuringThreshold=12 -XX:MaxTenuringThreshold=15 -XX:InlineSmallCode=9000 -XX:MaxInlineSize=270 -XX:FreqInlineSize=6000 -XX:+UseLargePages -XX:+UseParallelOldGC -XX:+AggressiveOpts |
| JVM Affinity: | start /NODE [0,1,2,3] /AFFINITY [0xFFFFFFF] |
| JVM Instances: | 4 |
| JVM Initial Heap (MB): | 21000 |
| JVM Maximum Heap (MB): | 21000 |
| JVM Address Bits: | 64 |
| Boot Firmware Version: | I42 v1.32 (02/01/2018) |
| Management Firmware Version: | 1.15 Aug 17 2017 |
| Workload Version: | SSJ 1.2.10 |
| Director Location: | Controller |
| Other Software: | HPE Composer Version 3.10.07 (HPE OneView) with HPE Synergy Custom SPP Bundle 2017.10.20180323; Microsoft Windows KB4054519, KB4056898 |
| JVM Instance | ssj_ops@100% |
|---|---|
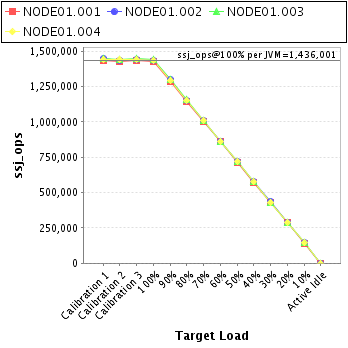
| NODE01.001 | 1,429,426 |
| NODE01.002 | 1,435,152 |
| NODE01.003 | 1,441,980 |
| NODE01.004 | 1,437,444 |
| ssj_ops@100% | 5,744,003 |
| ssj_ops@100% per JVM | 1,436,001 |
| Target Load | Actual Load | ssj_ops | |
|---|---|---|---|
| Target | Actual | ||
| Calibration 1 | 1,436,835 | ||
| Calibration 2 | 1,429,955 | ||
| Calibration 3 | 1,437,017 | ||
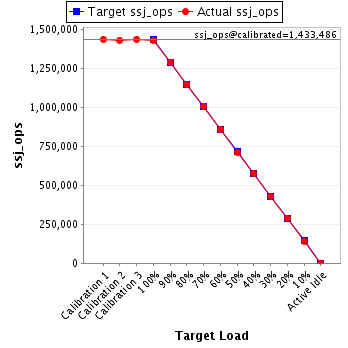
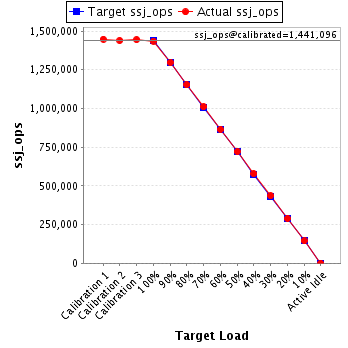
| ssj_ops@calibrated=1,433,486 | |||
| 100% | 99.7% | 1,433,486 | 1,429,426 |
| 90% | 90.0% | 1,290,138 | 1,290,033 |
| 80% | 80.1% | 1,146,789 | 1,147,553 |
| 70% | 70.1% | 1,003,440 | 1,005,176 |
| 60% | 60.0% | 860,092 | 859,966 |
| 50% | 49.7% | 716,743 | 712,493 |
| 40% | 40.1% | 573,394 | 574,901 |
| 30% | 29.9% | 430,046 | 429,066 |
| 20% | 20.1% | 286,697 | 288,658 |
| 10% | 9.9% | 143,349 | 142,348 |
| Active Idle | 0 | 0 | |
| Target Load | Actual Load | ssj_ops | |
|---|---|---|---|
| Target | Actual | ||
| Calibration 1 | 1,447,254 | ||
| Calibration 2 | 1,438,728 | ||
| Calibration 3 | 1,443,464 | ||
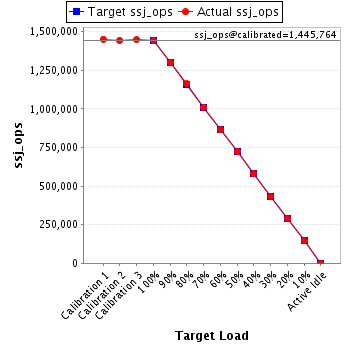
| ssj_ops@calibrated=1,441,096 | |||
| 100% | 99.6% | 1,441,096 | 1,435,152 |
| 90% | 90.1% | 1,296,987 | 1,297,733 |
| 80% | 80.0% | 1,152,877 | 1,152,857 |
| 70% | 70.1% | 1,008,767 | 1,010,560 |
| 60% | 60.1% | 864,658 | 865,447 |
| 50% | 50.0% | 720,548 | 720,896 |
| 40% | 40.1% | 576,439 | 577,837 |
| 30% | 30.2% | 432,329 | 435,466 |
| 20% | 20.1% | 288,219 | 289,010 |
| 10% | 10.0% | 144,110 | 144,461 |
| Active Idle | 0 | 0 | |
| Target Load | Actual Load | ssj_ops | |
|---|---|---|---|
| Target | Actual | ||
| Calibration 1 | 1,451,717 | ||
| Calibration 2 | 1,443,767 | ||
| Calibration 3 | 1,447,762 | ||
| ssj_ops@calibrated=1,445,764 | |||
| 100% | 99.7% | 1,445,764 | 1,441,980 |
| 90% | 90.0% | 1,301,188 | 1,301,874 |
| 80% | 80.4% | 1,156,612 | 1,162,633 |
| 70% | 70.0% | 1,012,035 | 1,011,338 |
| 60% | 59.8% | 867,459 | 864,768 |
| 50% | 50.0% | 722,882 | 723,135 |
| 40% | 40.0% | 578,306 | 578,439 |
| 30% | 29.9% | 433,729 | 432,599 |
| 20% | 20.0% | 289,153 | 288,622 |
| 10% | 10.0% | 144,576 | 144,236 |
| Active Idle | 0 | 0 | |
| Target Load | Actual Load | ssj_ops | |
|---|---|---|---|
| Target | Actual | ||
| Calibration 1 | 1,443,434 | ||
| Calibration 2 | 1,442,307 | ||
| Calibration 3 | 1,444,240 | ||
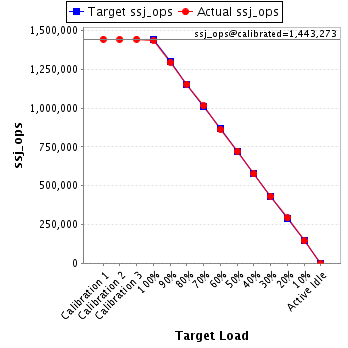
| ssj_ops@calibrated=1,443,273 | |||
| 100% | 99.6% | 1,443,273 | 1,437,444 |
| 90% | 89.8% | 1,298,946 | 1,295,722 |
| 80% | 80.0% | 1,154,619 | 1,154,365 |
| 70% | 70.2% | 1,010,291 | 1,013,687 |
| 60% | 59.8% | 865,964 | 863,347 |
| 50% | 50.0% | 721,637 | 722,226 |
| 40% | 39.9% | 577,309 | 575,381 |
| 30% | 30.0% | 432,982 | 432,707 |
| 20% | 20.2% | 288,655 | 292,015 |
| 10% | 10.0% | 144,327 | 143,946 |
| Active Idle | 0 | 0 | |