SPECpower_ssj2008
Host 'Node02' Performance Report
Copyright © 2007-2018 Standard Performance Evaluation Corporation
| Hewlett Packard Enterprise Synergy 660 Gen10 Compute Module | ssj_ops@100% = 11,514,997 ssj_ops@100% per JVM = 1,439,375 |
||||
| Test Sponsor: | Hewlett Packard Enterprise | SPEC License #: | 3 | Test Method: | Multi Node |
| Tested By: | Hewlett Packard Enterprise | Test Location: | Houston, TX, USA | Test Date: | Aug 27, 2018 |
| Hardware Availability: | Jun-2018 | Software Availability: | Mar-2018 | Publication: | Sep 12, 2018 |
| System Source: | Single Supplier | System Designation: | Server | Power Provisioning: | Line-powered |
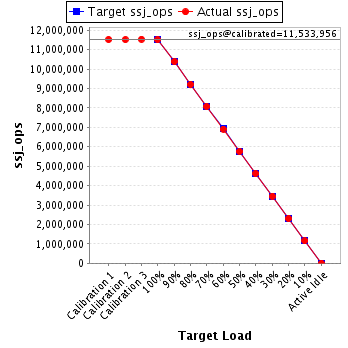
| Target Load | Actual Load | ssj_ops | |
|---|---|---|---|
| Target | Actual | ||
| Calibration 1 | 11,526,569 | ||
| Calibration 2 | 11,522,253 | ||
| Calibration 3 | 11,545,658 | ||
| ssj_ops@calibrated=11,533,956 | |||
| 100% | 99.8% | 11,533,956 | 11,514,997 |
| 90% | 90.1% | 10,380,560 | 10,390,419 |
| 80% | 79.9% | 9,227,164 | 9,213,264 |
| 70% | 70.0% | 8,073,769 | 8,079,337 |
| 60% | 60.0% | 6,920,373 | 6,917,200 |
| 50% | 50.0% | 5,766,978 | 5,763,758 |
| 40% | 40.0% | 4,613,582 | 4,618,084 |
| 30% | 30.0% | 3,460,187 | 3,461,799 |
| 20% | 20.0% | 2,306,791 | 2,307,629 |
| 10% | 10.0% | 1,153,396 | 1,151,401 |
| Active Idle | 0 | 0 | |
| Set Identifier: | SUT |
| Set Description: | System Under Test |
| # of Identical Nodes: | 5 |
| Comment: | SUT |
| Hardware | |
|---|---|
| Hardware Vendor: | Hewlett Packard Enterprise |
| Model: | Synergy 660 Gen10 Compute Module |
| Form Factor: | Other |
| CPU Name: | Intel Xeon Platinum 8180 2.50GHz |
| CPU Characteristics: | 28-Core, 2.50 GHz, 38.5MB L3 Cache |
| CPU Frequency (MHz): | 2500 |
| CPU(s) Enabled: | 112 cores, 4 chips, 28 cores/chip |
| Hardware Threads: | 224 (2 / core) |
| CPU(s) Orderable: | 1,2,3,4 chips |
| Primary Cache: | 32 KB I + 32 KB D on chip per core |
| Secondary Cache: | 1 MB I+D on chip per core |
| Tertiary Cache: | 39424 KB I+D on chip per chip |
| Other Cache: | None |
| Memory Amount (GB): | 384 |
| # and size of DIMM: | 24 x 16384 MB |
| Memory Details: | 24 x 16GB 2Rx8 PC4-2666-V ECC; slots 1, 3, 5, 8, 10 and 12 populated on each CPU socket |
| Power Supply Quantity and Rating (W): | None |
| Power Supply Details: | Shared |
| Disk Drive: | 1 x HPE 480GB SATA 6G Read Intensive M.2 (875319-B21) |
| Disk Controller: | 1 x HPE Smart Array S100i SR Gen10 (784308-B21) |
| # and type of Network Interface Cards (NICs) Installed: | 1 x HPE Synergy 3820C 10/20Gb 2-port Converged Network Adapter (777430-B21) |
| NICs Enabled in Firmware / OS / Connected: | 2/1/1 |
| Network Speed (Mbit): | 10000 |
| Keyboard: | None |
| Mouse: | None |
| Monitor: | None |
| Optical Drives: | No |
| Other Hardware: | None |
| Software | |
|---|---|
| Power Management: | Enabled (see SUT Notes) |
| Operating System (OS): | Windows Server 2012 R2 Datacenter |
| OS Version: | Version 6.3 (Build 9600) |
| Filesystem: | NTFS |
| JVM Vendor: | Oracle Corporation |
| JVM Version: | Oracle Java HotSpot(TM) 64-Bit Server VM (build 24.80-b11, mixed mode), version 1.7.0_80 |
| JVM Command-line Options: | -server -Xmn19g -Xms21g -Xmx21g -XX:SurvivorRatio=1 -XX:TargetSurvivorRatio=99 -XX:AllocatePrefetchDistance=256 -XX:AllocatePrefetchLines=4 -XX:LoopUnrollLimit=30 -XX:InitialTenuringThreshold=12 -XX:MaxTenuringThreshold=15 -XX:ParallelGCThreads=28 -XX:InlineSmallCode=3900 -XX:MaxInlineSize=270 -XX:FreqInlineSize=2500 -XX:+AggressiveOpts -XX:+UseLargePages -XX:+UseParallelOldGC |
| JVM Affinity: | start /NODE [0,2,4,6] /AFFINITY [0x0000000FC0FF, 0xFC0FF0000000]; start /NODE [1,3,5,7] /AFFINITY [0x0000000FF03F,0xFF03F0000000] |
| JVM Instances: | 8 |
| JVM Initial Heap (MB): | 21000 |
| JVM Maximum Heap (MB): | 21000 |
| JVM Address Bits: | 64 |
| Boot Firmware Version: | I43 v1.32 (02/01/2018) |
| Management Firmware Version: | 1.15 August 17 2017 |
| Workload Version: | SSJ 1.2.10 |
| Director Location: | Controller |
| Other Software: | HPE Composer Version 3.10.07 (HPE OneView) with HPE Synergy Custom SPP Bundle 2017.10.20180323; Microsoft Windows KB4054519, KB4056898 |
| JVM Instance | ssj_ops@100% |
|---|---|
| Node02.001 | 1,449,459 |
| Node02.002 | 1,440,942 |
| Node02.003 | 1,453,549 |
| Node02.004 | 1,434,924 |
| Node02.005 | 1,438,925 |
| Node02.006 | 1,431,022 |
| Node02.007 | 1,434,327 |
| Node02.008 | 1,431,850 |
| ssj_ops@100% | 11,514,997 |
| ssj_ops@100% per JVM | 1,439,375 |

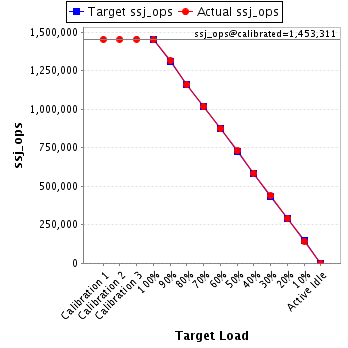
| Target Load | Actual Load | ssj_ops | |
|---|---|---|---|
| Target | Actual | ||
| Calibration 1 | 1,451,736 | ||
| Calibration 2 | 1,452,491 | ||
| Calibration 3 | 1,454,132 | ||
| ssj_ops@calibrated=1,453,311 | |||
| 100% | 99.7% | 1,453,311 | 1,449,459 |
| 90% | 90.4% | 1,307,980 | 1,313,388 |
| 80% | 79.8% | 1,162,649 | 1,159,710 |
| 70% | 69.9% | 1,017,318 | 1,016,342 |
| 60% | 60.0% | 871,987 | 872,228 |
| 50% | 50.1% | 726,656 | 728,814 |
| 40% | 40.2% | 581,324 | 584,129 |
| 30% | 30.0% | 435,993 | 436,596 |
| 20% | 20.0% | 290,662 | 290,722 |
| 10% | 9.9% | 145,331 | 143,950 |
| Active Idle | 0 | 0 | |
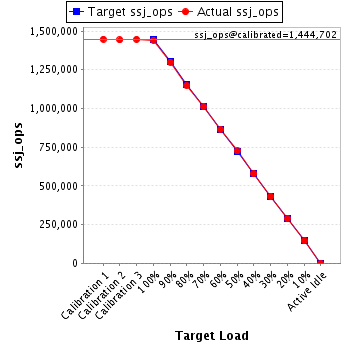
| Target Load | Actual Load | ssj_ops | |
|---|---|---|---|
| Target | Actual | ||
| Calibration 1 | 1,447,487 | ||
| Calibration 2 | 1,442,427 | ||
| Calibration 3 | 1,446,977 | ||
| ssj_ops@calibrated=1,444,702 | |||
| 100% | 99.7% | 1,444,702 | 1,440,942 |
| 90% | 90.0% | 1,300,232 | 1,299,702 |
| 80% | 79.6% | 1,155,761 | 1,149,922 |
| 70% | 69.9% | 1,011,291 | 1,009,940 |
| 60% | 60.0% | 866,821 | 866,226 |
| 50% | 50.2% | 722,351 | 725,352 |
| 40% | 40.0% | 577,881 | 578,417 |
| 30% | 29.9% | 433,411 | 431,845 |
| 20% | 19.9% | 288,940 | 287,666 |
| 10% | 10.0% | 144,470 | 144,448 |
| Active Idle | 0 | 0 | |
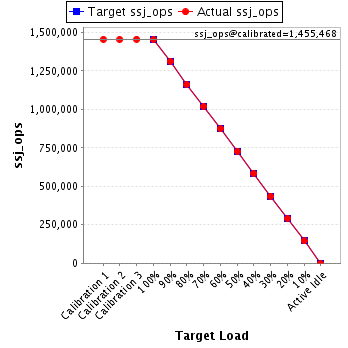
| Target Load | Actual Load | ssj_ops | |
|---|---|---|---|
| Target | Actual | ||
| Calibration 1 | 1,455,152 | ||
| Calibration 2 | 1,454,574 | ||
| Calibration 3 | 1,456,363 | ||
| ssj_ops@calibrated=1,455,468 | |||
| 100% | 99.9% | 1,455,468 | 1,453,549 |
| 90% | 90.2% | 1,309,922 | 1,312,448 |
| 80% | 79.9% | 1,164,375 | 1,162,322 |
| 70% | 70.1% | 1,018,828 | 1,019,644 |
| 60% | 60.0% | 873,281 | 873,190 |
| 50% | 50.0% | 727,734 | 728,225 |
| 40% | 40.1% | 582,187 | 583,550 |
| 30% | 30.0% | 436,641 | 435,974 |
| 20% | 20.0% | 291,094 | 290,797 |
| 10% | 9.9% | 145,547 | 144,786 |
| Active Idle | 0 | 0 | |
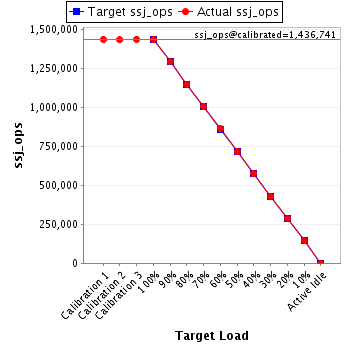
| Target Load | Actual Load | ssj_ops | |
|---|---|---|---|
| Target | Actual | ||
| Calibration 1 | 1,438,465 | ||
| Calibration 2 | 1,434,561 | ||
| Calibration 3 | 1,438,921 | ||
| ssj_ops@calibrated=1,436,741 | |||
| 100% | 99.9% | 1,436,741 | 1,434,924 |
| 90% | 90.0% | 1,293,067 | 1,293,361 |
| 80% | 80.0% | 1,149,393 | 1,149,973 |
| 70% | 70.1% | 1,005,718 | 1,007,174 |
| 60% | 60.1% | 862,044 | 862,867 |
| 50% | 49.8% | 718,370 | 715,346 |
| 40% | 40.1% | 574,696 | 575,805 |
| 30% | 30.0% | 431,022 | 430,536 |
| 20% | 20.1% | 287,348 | 288,171 |
| 10% | 10.0% | 143,674 | 143,533 |
| Active Idle | 0 | 0 | |
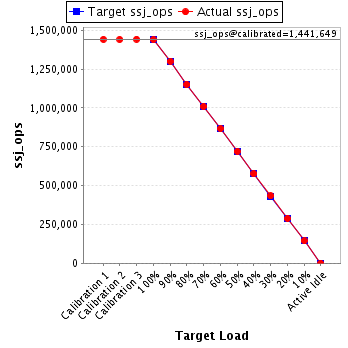
| Target Load | Actual Load | ssj_ops | |
|---|---|---|---|
| Target | Actual | ||
| Calibration 1 | 1,441,628 | ||
| Calibration 2 | 1,440,626 | ||
| Calibration 3 | 1,442,672 | ||
| ssj_ops@calibrated=1,441,649 | |||
| 100% | 99.8% | 1,441,649 | 1,438,925 |
| 90% | 90.2% | 1,297,484 | 1,300,152 |
| 80% | 79.8% | 1,153,319 | 1,150,779 |
| 70% | 70.1% | 1,009,154 | 1,010,112 |
| 60% | 60.1% | 864,990 | 866,067 |
| 50% | 50.0% | 720,825 | 720,221 |
| 40% | 39.9% | 576,660 | 575,247 |
| 30% | 30.0% | 432,495 | 433,067 |
| 20% | 20.0% | 288,330 | 288,264 |
| 10% | 10.0% | 144,165 | 143,935 |
| Active Idle | 0 | 0 | |
| Target Load | Actual Load | ssj_ops | |
|---|---|---|---|
| Target | Actual | ||
| Calibration 1 | 1,434,200 | ||
| Calibration 2 | 1,433,026 | ||
| Calibration 3 | 1,434,788 | ||
| ssj_ops@calibrated=1,433,907 | |||
| 100% | 99.8% | 1,433,907 | 1,431,022 |
| 90% | 90.0% | 1,290,517 | 1,290,390 |
| 80% | 80.1% | 1,147,126 | 1,148,261 |
| 70% | 70.0% | 1,003,735 | 1,004,194 |
| 60% | 59.9% | 860,344 | 859,029 |
| 50% | 49.9% | 716,954 | 716,190 |
| 40% | 40.1% | 573,563 | 574,842 |
| 30% | 30.1% | 430,172 | 431,570 |
| 20% | 20.0% | 286,781 | 286,652 |
| 10% | 10.0% | 143,391 | 143,277 |
| Active Idle | 0 | 0 | |

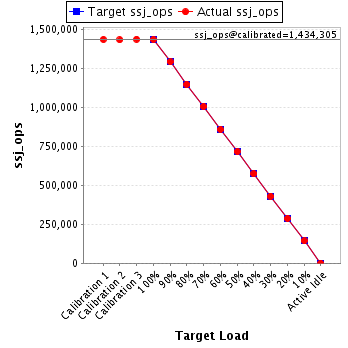
| Target Load | Actual Load | ssj_ops | |
|---|---|---|---|
| Target | Actual | ||
| Calibration 1 | 1,434,498 | ||
| Calibration 2 | 1,431,888 | ||
| Calibration 3 | 1,436,722 | ||
| ssj_ops@calibrated=1,434,305 | |||
| 100% | 100.0% | 1,434,305 | 1,434,327 |
| 90% | 90.0% | 1,290,874 | 1,291,344 |
| 80% | 80.0% | 1,147,444 | 1,146,805 |
| 70% | 70.1% | 1,004,013 | 1,005,564 |
| 60% | 59.8% | 860,583 | 858,203 |
| 50% | 49.9% | 717,152 | 715,637 |
| 40% | 40.0% | 573,722 | 573,344 |
| 30% | 30.0% | 430,291 | 430,368 |
| 20% | 20.0% | 286,861 | 287,251 |
| 10% | 10.0% | 143,430 | 143,826 |
| Active Idle | 0 | 0 | |
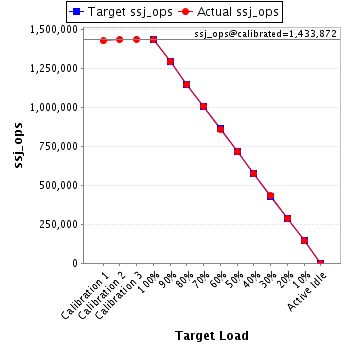
| Target Load | Actual Load | ssj_ops | |
|---|---|---|---|
| Target | Actual | ||
| Calibration 1 | 1,423,404 | ||
| Calibration 2 | 1,432,661 | ||
| Calibration 3 | 1,435,084 | ||
| ssj_ops@calibrated=1,433,872 | |||
| 100% | 99.9% | 1,433,872 | 1,431,850 |
| 90% | 89.9% | 1,290,485 | 1,289,634 |
| 80% | 79.9% | 1,147,098 | 1,145,492 |
| 70% | 70.2% | 1,003,711 | 1,006,368 |
| 60% | 59.9% | 860,323 | 859,389 |
| 50% | 49.8% | 716,936 | 713,973 |
| 40% | 39.9% | 573,549 | 572,751 |
| 30% | 30.1% | 430,162 | 431,844 |
| 20% | 20.1% | 286,774 | 288,107 |
| 10% | 10.0% | 143,387 | 143,646 |
| Active Idle | 0 | 0 | |