
SPECpower_ssj2008
Host 'Node04' Performance Report
Copyright © 2007-2018 Standard Performance Evaluation Corporation
| Hewlett Packard Enterprise Synergy 660 Gen10 Compute Module | ssj_ops@100% = 11,543,185 ssj_ops@100% per JVM = 1,442,898 |
||||
| Test Sponsor: | Hewlett Packard Enterprise | SPEC License #: | 3 | Test Method: | Multi Node |
| Tested By: | Hewlett Packard Enterprise | Test Location: | Houston, TX, USA | Test Date: | Aug 27, 2018 |
| Hardware Availability: | Jun-2018 | Software Availability: | Mar-2018 | Publication: | Sep 12, 2018 |
| System Source: | Single Supplier | System Designation: | Server | Power Provisioning: | Line-powered |
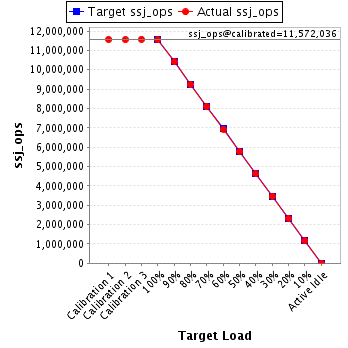
| Target Load | Actual Load | ssj_ops | |
|---|---|---|---|
| Target | Actual | ||
| Calibration 1 | 11,570,470 | ||
| Calibration 2 | 11,560,062 | ||
| Calibration 3 | 11,584,011 | ||
| ssj_ops@calibrated=11,572,036 | |||
| 100% | 99.8% | 11,572,036 | 11,543,185 |
| 90% | 90.0% | 10,414,833 | 10,419,848 |
| 80% | 80.0% | 9,257,629 | 9,256,726 |
| 70% | 70.0% | 8,100,426 | 8,100,428 |
| 60% | 60.0% | 6,943,222 | 6,940,192 |
| 50% | 50.0% | 5,786,018 | 5,791,303 |
| 40% | 40.0% | 4,628,815 | 4,631,173 |
| 30% | 30.0% | 3,471,611 | 3,467,336 |
| 20% | 20.0% | 2,314,407 | 2,314,043 |
| 10% | 10.0% | 1,157,204 | 1,155,741 |
| Active Idle | 0 | 0 | |
| Set Identifier: | SUT |
| Set Description: | System Under Test |
| # of Identical Nodes: | 5 |
| Comment: | SUT |
| Hardware | |
|---|---|
| Hardware Vendor: | Hewlett Packard Enterprise |
| Model: | Synergy 660 Gen10 Compute Module |
| Form Factor: | Other |
| CPU Name: | Intel Xeon Platinum 8180 2.50GHz |
| CPU Characteristics: | 28-Core, 2.50 GHz, 38.5MB L3 Cache |
| CPU Frequency (MHz): | 2500 |
| CPU(s) Enabled: | 112 cores, 4 chips, 28 cores/chip |
| Hardware Threads: | 224 (2 / core) |
| CPU(s) Orderable: | 1,2,3,4 chips |
| Primary Cache: | 32 KB I + 32 KB D on chip per core |
| Secondary Cache: | 1 MB I+D on chip per core |
| Tertiary Cache: | 39424 KB I+D on chip per chip |
| Other Cache: | None |
| Memory Amount (GB): | 384 |
| # and size of DIMM: | 24 x 16384 MB |
| Memory Details: | 24 x 16GB 2Rx8 PC4-2666-V ECC; slots 1, 3, 5, 8, 10 and 12 populated on each CPU socket |
| Power Supply Quantity and Rating (W): | None |
| Power Supply Details: | Shared |
| Disk Drive: | 1 x HPE 480GB SATA 6G Read Intensive M.2 (875319-B21) |
| Disk Controller: | 1 x HPE Smart Array S100i SR Gen10 (784308-B21) |
| # and type of Network Interface Cards (NICs) Installed: | 1 x HPE Synergy 3820C 10/20Gb 2-port Converged Network Adapter (777430-B21) |
| NICs Enabled in Firmware / OS / Connected: | 2/1/1 |
| Network Speed (Mbit): | 10000 |
| Keyboard: | None |
| Mouse: | None |
| Monitor: | None |
| Optical Drives: | No |
| Other Hardware: | None |
| Software | |
|---|---|
| Power Management: | Enabled (see SUT Notes) |
| Operating System (OS): | Windows Server 2012 R2 Datacenter |
| OS Version: | Version 6.3 (Build 9600) |
| Filesystem: | NTFS |
| JVM Vendor: | Oracle Corporation |
| JVM Version: | Oracle Java HotSpot(TM) 64-Bit Server VM (build 24.80-b11, mixed mode), version 1.7.0_80 |
| JVM Command-line Options: | -server -Xmn19g -Xms21g -Xmx21g -XX:SurvivorRatio=1 -XX:TargetSurvivorRatio=99 -XX:AllocatePrefetchDistance=256 -XX:AllocatePrefetchLines=4 -XX:LoopUnrollLimit=30 -XX:InitialTenuringThreshold=12 -XX:MaxTenuringThreshold=15 -XX:ParallelGCThreads=28 -XX:InlineSmallCode=3900 -XX:MaxInlineSize=270 -XX:FreqInlineSize=2500 -XX:+AggressiveOpts -XX:+UseLargePages -XX:+UseParallelOldGC |
| JVM Affinity: | start /NODE [0,2,4,6] /AFFINITY [0x0000000FC0FF, 0xFC0FF0000000]; start /NODE [1,3,5,7] /AFFINITY [0x0000000FF03F,0xFF03F0000000] |
| JVM Instances: | 8 |
| JVM Initial Heap (MB): | 21000 |
| JVM Maximum Heap (MB): | 21000 |
| JVM Address Bits: | 64 |
| Boot Firmware Version: | I43 v1.32 (02/01/2018) |
| Management Firmware Version: | 1.15 August 17 2017 |
| Workload Version: | SSJ 1.2.10 |
| Director Location: | Controller |
| Other Software: | HPE Composer Version 3.10.07 (HPE OneView) with HPE Synergy Custom SPP Bundle 2017.10.20180323; Microsoft Windows KB4054519, KB4056898 |
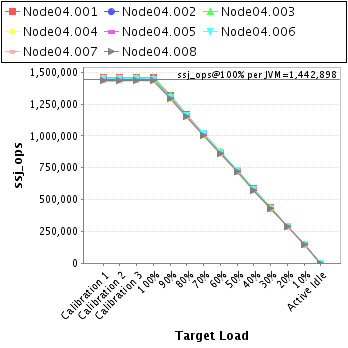
| JVM Instance | ssj_ops@100% |
|---|---|
| Node04.001 | 1,456,183 |
| Node04.002 | 1,444,367 |
| Node04.003 | 1,458,357 |
| Node04.004 | 1,437,635 |
| Node04.005 | 1,436,087 |
| Node04.006 | 1,447,585 |
| Node04.007 | 1,428,649 |
| Node04.008 | 1,434,321 |
| ssj_ops@100% | 11,543,185 |
| ssj_ops@100% per JVM | 1,442,898 |
| Target Load | Actual Load | ssj_ops | |
|---|---|---|---|
| Target | Actual | ||
| Calibration 1 | 1,461,908 | ||
| Calibration 2 | 1,459,494 | ||
| Calibration 3 | 1,461,210 | ||
| ssj_ops@calibrated=1,460,352 | |||
| 100% | 99.7% | 1,460,352 | 1,456,183 |
| 90% | 90.1% | 1,314,317 | 1,315,326 |
| 80% | 80.0% | 1,168,282 | 1,167,899 |
| 70% | 70.1% | 1,022,246 | 1,023,104 |
| 60% | 59.8% | 876,211 | 872,818 |
| 50% | 50.0% | 730,176 | 730,502 |
| 40% | 40.1% | 584,141 | 585,082 |
| 30% | 30.0% | 438,106 | 437,998 |
| 20% | 19.9% | 292,070 | 290,143 |
| 10% | 9.9% | 146,035 | 144,732 |
| Active Idle | 0 | 0 | |

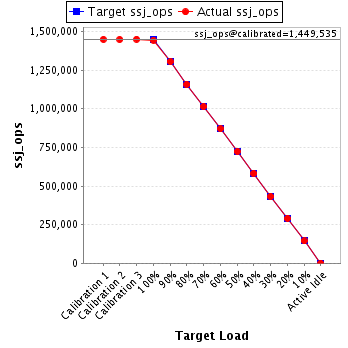
| Target Load | Actual Load | ssj_ops | |
|---|---|---|---|
| Target | Actual | ||
| Calibration 1 | 1,449,411 | ||
| Calibration 2 | 1,448,409 | ||
| Calibration 3 | 1,450,660 | ||
| ssj_ops@calibrated=1,449,535 | |||
| 100% | 99.6% | 1,449,535 | 1,444,367 |
| 90% | 90.1% | 1,304,581 | 1,305,567 |
| 80% | 79.9% | 1,159,628 | 1,158,319 |
| 70% | 70.0% | 1,014,674 | 1,014,729 |
| 60% | 60.0% | 869,721 | 869,697 |
| 50% | 49.9% | 724,767 | 723,592 |
| 40% | 40.1% | 579,814 | 581,164 |
| 30% | 29.8% | 434,860 | 432,380 |
| 20% | 20.1% | 289,907 | 290,870 |
| 10% | 10.0% | 144,953 | 144,308 |
| Active Idle | 0 | 0 | |
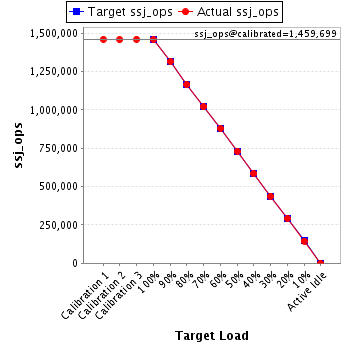
| Target Load | Actual Load | ssj_ops | |
|---|---|---|---|
| Target | Actual | ||
| Calibration 1 | 1,459,871 | ||
| Calibration 2 | 1,458,206 | ||
| Calibration 3 | 1,461,193 | ||
| ssj_ops@calibrated=1,459,699 | |||
| 100% | 99.9% | 1,459,699 | 1,458,357 |
| 90% | 90.1% | 1,313,729 | 1,315,182 |
| 80% | 79.8% | 1,167,759 | 1,164,699 |
| 70% | 69.9% | 1,021,790 | 1,020,946 |
| 60% | 60.3% | 875,820 | 879,981 |
| 50% | 50.0% | 729,850 | 730,047 |
| 40% | 40.1% | 583,880 | 585,531 |
| 30% | 30.0% | 437,910 | 438,024 |
| 20% | 20.0% | 291,940 | 292,616 |
| 10% | 9.9% | 145,970 | 145,149 |
| Active Idle | 0 | 0 | |
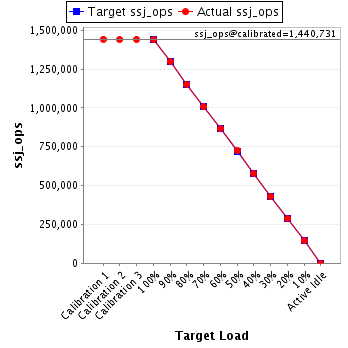
| Target Load | Actual Load | ssj_ops | |
|---|---|---|---|
| Target | Actual | ||
| Calibration 1 | 1,442,027 | ||
| Calibration 2 | 1,439,782 | ||
| Calibration 3 | 1,441,680 | ||
| ssj_ops@calibrated=1,440,731 | |||
| 100% | 99.8% | 1,440,731 | 1,437,635 |
| 90% | 90.1% | 1,296,658 | 1,297,951 |
| 80% | 79.9% | 1,152,585 | 1,151,726 |
| 70% | 69.9% | 1,008,512 | 1,006,989 |
| 60% | 60.0% | 864,438 | 864,893 |
| 50% | 50.1% | 720,365 | 722,413 |
| 40% | 40.0% | 576,292 | 576,834 |
| 30% | 29.9% | 432,219 | 430,607 |
| 20% | 20.0% | 288,146 | 288,370 |
| 10% | 10.1% | 144,073 | 144,976 |
| Active Idle | 0 | 0 | |
| Target Load | Actual Load | ssj_ops | |
|---|---|---|---|
| Target | Actual | ||
| Calibration 1 | 1,440,503 | ||
| Calibration 2 | 1,442,286 | ||
| Calibration 3 | 1,444,794 | ||
| ssj_ops@calibrated=1,443,540 | |||
| 100% | 99.5% | 1,443,540 | 1,436,087 |
| 90% | 90.1% | 1,299,186 | 1,300,597 |
| 80% | 79.9% | 1,154,832 | 1,153,132 |
| 70% | 70.1% | 1,010,478 | 1,011,746 |
| 60% | 60.0% | 866,124 | 866,818 |
| 50% | 50.1% | 721,770 | 723,221 |
| 40% | 39.9% | 577,416 | 575,567 |
| 30% | 30.2% | 433,062 | 435,606 |
| 20% | 19.9% | 288,708 | 287,875 |
| 10% | 10.0% | 144,354 | 144,340 |
| Active Idle | 0 | 0 | |

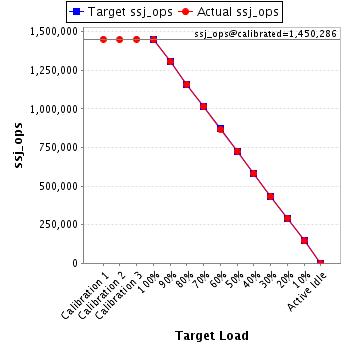
| Target Load | Actual Load | ssj_ops | |
|---|---|---|---|
| Target | Actual | ||
| Calibration 1 | 1,451,256 | ||
| Calibration 2 | 1,448,814 | ||
| Calibration 3 | 1,451,758 | ||
| ssj_ops@calibrated=1,450,286 | |||
| 100% | 99.8% | 1,450,286 | 1,447,585 |
| 90% | 90.0% | 1,305,257 | 1,305,125 |
| 80% | 80.0% | 1,160,229 | 1,160,439 |
| 70% | 70.1% | 1,015,200 | 1,016,653 |
| 60% | 59.9% | 870,171 | 868,890 |
| 50% | 50.1% | 725,143 | 726,693 |
| 40% | 40.0% | 580,114 | 580,493 |
| 30% | 29.8% | 435,086 | 432,866 |
| 20% | 20.1% | 290,057 | 291,490 |
| 10% | 10.0% | 145,029 | 145,409 |
| Active Idle | 0 | 0 | |
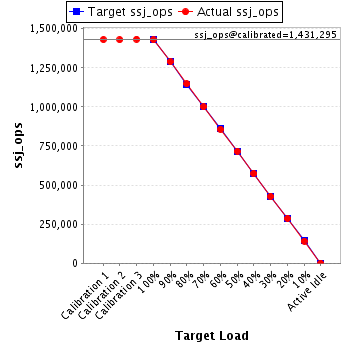
| Target Load | Actual Load | ssj_ops | |
|---|---|---|---|
| Target | Actual | ||
| Calibration 1 | 1,430,240 | ||
| Calibration 2 | 1,429,352 | ||
| Calibration 3 | 1,433,238 | ||
| ssj_ops@calibrated=1,431,295 | |||
| 100% | 99.8% | 1,431,295 | 1,428,649 |
| 90% | 90.0% | 1,288,166 | 1,288,823 |
| 80% | 80.2% | 1,145,036 | 1,147,736 |
| 70% | 69.9% | 1,001,907 | 1,000,409 |
| 60% | 59.9% | 858,777 | 857,353 |
| 50% | 50.1% | 715,648 | 716,711 |
| 40% | 40.0% | 572,518 | 573,021 |
| 30% | 29.9% | 429,389 | 427,847 |
| 20% | 20.0% | 286,259 | 286,630 |
| 10% | 9.9% | 143,130 | 141,927 |
| Active Idle | 0 | 0 | |
| Target Load | Actual Load | ssj_ops | |
|---|---|---|---|
| Target | Actual | ||
| Calibration 1 | 1,435,253 | ||
| Calibration 2 | 1,433,720 | ||
| Calibration 3 | 1,439,478 | ||
| ssj_ops@calibrated=1,436,599 | |||
| 100% | 99.8% | 1,436,599 | 1,434,321 |
| 90% | 89.9% | 1,292,939 | 1,291,277 |
| 80% | 80.2% | 1,149,279 | 1,152,776 |
| 70% | 70.0% | 1,005,619 | 1,005,852 |
| 60% | 59.8% | 861,959 | 859,743 |
| 50% | 50.0% | 718,299 | 718,124 |
| 40% | 39.9% | 574,640 | 573,483 |
| 30% | 30.1% | 430,980 | 432,009 |
| 20% | 19.9% | 287,320 | 286,048 |
| 10% | 10.1% | 143,660 | 144,900 |
| Active Idle | 0 | 0 | |
