SPECpower_ssj2008
Host 'Node05' Performance Report
Copyright © 2007-2018 Standard Performance Evaluation Corporation
| Hewlett Packard Enterprise Synergy 660 Gen10 Compute Module | ssj_ops@100% = 11,495,241 ssj_ops@100% per JVM = 1,436,905 |
||||
| Test Sponsor: | Hewlett Packard Enterprise | SPEC License #: | 3 | Test Method: | Multi Node |
| Tested By: | Hewlett Packard Enterprise | Test Location: | Houston, TX, USA | Test Date: | Aug 27, 2018 |
| Hardware Availability: | Jun-2018 | Software Availability: | Mar-2018 | Publication: | Sep 12, 2018 |
| System Source: | Single Supplier | System Designation: | Server | Power Provisioning: | Line-powered |
| Target Load | Actual Load | ssj_ops | |
|---|---|---|---|
| Target | Actual | ||
| Calibration 1 | 11,543,242 | ||
| Calibration 2 | 11,525,312 | ||
| Calibration 3 | 11,536,769 | ||
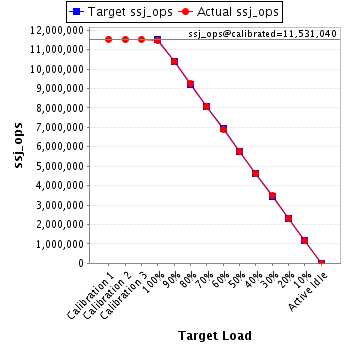
| ssj_ops@calibrated=11,531,040 | |||
| 100% | 99.7% | 11,531,040 | 11,495,241 |
| 90% | 90.0% | 10,377,936 | 10,383,626 |
| 80% | 80.1% | 9,224,832 | 9,234,012 |
| 70% | 69.9% | 8,071,728 | 8,065,289 |
| 60% | 60.0% | 6,918,624 | 6,914,314 |
| 50% | 50.1% | 5,765,520 | 5,772,477 |
| 40% | 40.0% | 4,612,416 | 4,611,967 |
| 30% | 30.1% | 3,459,312 | 3,465,744 |
| 20% | 20.0% | 2,306,208 | 2,307,985 |
| 10% | 10.0% | 1,153,104 | 1,151,972 |
| Active Idle | 0 | 0 | |
| Set Identifier: | SUT |
| Set Description: | System Under Test |
| # of Identical Nodes: | 3 |
| Comment: | SUT |
| Hardware | |
|---|---|
| Hardware Vendor: | Hewlett Packard Enterprise |
| Model: | Synergy 660 Gen10 Compute Module |
| Form Factor: | Other |
| CPU Name: | Intel Xeon Platinum 8180 2.50GHz |
| CPU Characteristics: | 28-Core, 2.50 GHz, 38.5MB L3 Cache |
| CPU Frequency (MHz): | 2500 |
| CPU(s) Enabled: | 112 cores, 4 chips, 28 cores/chip |
| Hardware Threads: | 224 (2 / core) |
| CPU(s) Orderable: | 1,2,3,4 chips |
| Primary Cache: | 32 KB I + 32 KB D on chip per core |
| Secondary Cache: | 1 MB I+D on chip per core |
| Tertiary Cache: | 39424 KB I+D on chip per chip |
| Other Cache: | None |
| Memory Amount (GB): | 384 |
| # and size of DIMM: | 24 x 16384 MB |
| Memory Details: | 24 x 16GB 2Rx8 PC4-2666-V ECC; slots 1, 3, 5, 8, 10 and 12 populated on each CPU socket |
| Power Supply Quantity and Rating (W): | None |
| Power Supply Details: | Shared |
| Disk Drive: | 1 x HPE 480GB SATA 6G Read Intensive M.2 (875319-B21) |
| Disk Controller: | 1 x HPE Smart Array S100i SR Gen10 (784308-B21) |
| # and type of Network Interface Cards (NICs) Installed: | 1 x HPE Synergy 3820C 10/20Gb 2-port Converged Network Adapter (777430-B21) |
| NICs Enabled in Firmware / OS / Connected: | 2/1/1 |
| Network Speed (Mbit): | 10000 |
| Keyboard: | None |
| Mouse: | None |
| Monitor: | None |
| Optical Drives: | No |
| Other Hardware: | None |
| Software | |
|---|---|
| Power Management: | Enabled (see SUT Notes) |
| Operating System (OS): | Windows Server 2012 R2 Datacenter |
| OS Version: | Version 6.3 (Build 9600) |
| Filesystem: | NTFS |
| JVM Vendor: | Oracle Corporation |
| JVM Version: | Oracle Java HotSpot(TM) 64-Bit Server VM (build 24.80-b11, mixed mode), version 1.7.0_80 |
| JVM Command-line Options: | -server -Xmn19g -Xms21g -Xmx21g -XX:SurvivorRatio=1 -XX:TargetSurvivorRatio=99 -XX:AllocatePrefetchDistance=256 -XX:AllocatePrefetchLines=4 -XX:LoopUnrollLimit=30 -XX:InitialTenuringThreshold=12 -XX:MaxTenuringThreshold=15 -XX:ParallelGCThreads=28 -XX:InlineSmallCode=3900 -XX:MaxInlineSize=270 -XX:FreqInlineSize=2500 -XX:+AggressiveOpts -XX:+UseLargePages -XX:+UseParallelOldGC |
| JVM Affinity: | start /NODE [0,2,4,6] /AFFINITY [0x0000000FC0FF, 0xFC0FF0000000]; start /NODE [1,3,5,7] /AFFINITY [0x0000000FF03F,0xFF03F0000000] |
| JVM Instances: | 8 |
| JVM Initial Heap (MB): | 21000 |
| JVM Maximum Heap (MB): | 21000 |
| JVM Address Bits: | 64 |
| Boot Firmware Version: | I43 v1.32 (02/01/2018) |
| Management Firmware Version: | 1.15 August 17 2017 |
| Workload Version: | SSJ 1.2.10 |
| Director Location: | Controller |
| Other Software: | HPE Composer Version 3.10.07 (HPE OneView) with HPE Synergy Custom SPP Bundle 2017.10.20180323; Microsoft Windows KB4054519, KB4056898 |
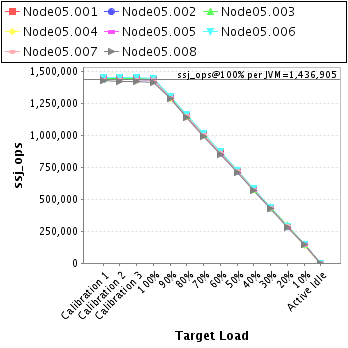
| JVM Instance | ssj_ops@100% |
|---|---|
| Node05.001 | 1,443,342 |
| Node05.002 | 1,435,254 |
| Node05.003 | 1,439,323 |
| Node05.004 | 1,436,144 |
| Node05.005 | 1,437,299 |
| Node05.006 | 1,449,646 |
| Node05.007 | 1,434,969 |
| Node05.008 | 1,419,265 |
| ssj_ops@100% | 11,495,241 |
| ssj_ops@100% per JVM | 1,436,905 |
| Target Load | Actual Load | ssj_ops | |
|---|---|---|---|
| Target | Actual | ||
| Calibration 1 | 1,448,113 | ||
| Calibration 2 | 1,445,069 | ||
| Calibration 3 | 1,446,271 | ||
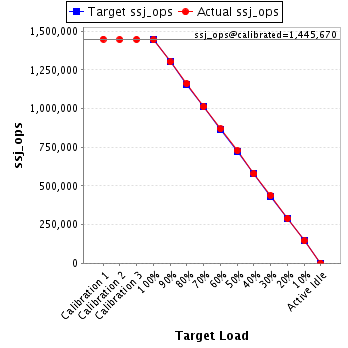
| ssj_ops@calibrated=1,445,670 | |||
| 100% | 99.8% | 1,445,670 | 1,443,342 |
| 90% | 90.0% | 1,301,103 | 1,301,578 |
| 80% | 80.3% | 1,156,536 | 1,161,071 |
| 70% | 70.0% | 1,011,969 | 1,012,028 |
| 60% | 60.0% | 867,402 | 867,914 |
| 50% | 50.3% | 722,835 | 726,792 |
| 40% | 40.0% | 578,268 | 577,664 |
| 30% | 30.2% | 433,701 | 436,701 |
| 20% | 20.0% | 289,134 | 289,738 |
| 10% | 10.1% | 144,567 | 145,742 |
| Active Idle | 0 | 0 | |
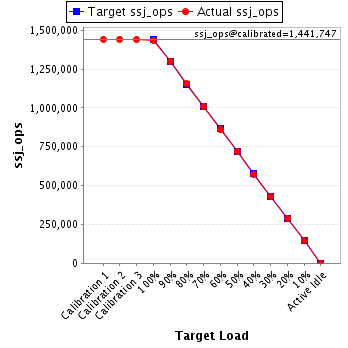
| Target Load | Actual Load | ssj_ops | |
|---|---|---|---|
| Target | Actual | ||
| Calibration 1 | 1,442,025 | ||
| Calibration 2 | 1,442,650 | ||
| Calibration 3 | 1,440,843 | ||
| ssj_ops@calibrated=1,441,747 | |||
| 100% | 99.5% | 1,441,747 | 1,435,254 |
| 90% | 90.3% | 1,297,572 | 1,301,674 |
| 80% | 80.1% | 1,153,397 | 1,154,462 |
| 70% | 70.1% | 1,009,223 | 1,011,132 |
| 60% | 59.8% | 865,048 | 862,075 |
| 50% | 50.1% | 720,873 | 722,105 |
| 40% | 39.8% | 576,699 | 574,425 |
| 30% | 30.0% | 432,524 | 432,205 |
| 20% | 20.1% | 288,349 | 290,455 |
| 10% | 10.0% | 144,175 | 144,792 |
| Active Idle | 0 | 0 | |
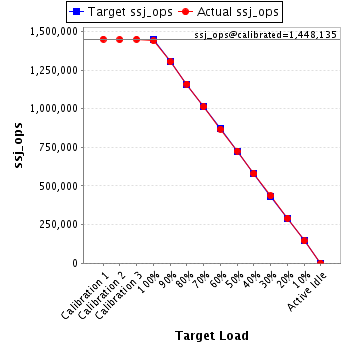
| Target Load | Actual Load | ssj_ops | |
|---|---|---|---|
| Target | Actual | ||
| Calibration 1 | 1,449,806 | ||
| Calibration 2 | 1,446,843 | ||
| Calibration 3 | 1,449,428 | ||
| ssj_ops@calibrated=1,448,135 | |||
| 100% | 99.4% | 1,448,135 | 1,439,323 |
| 90% | 90.1% | 1,303,322 | 1,304,074 |
| 80% | 80.1% | 1,158,508 | 1,159,698 |
| 70% | 69.9% | 1,013,695 | 1,012,544 |
| 60% | 60.0% | 868,881 | 868,461 |
| 50% | 50.2% | 724,068 | 726,272 |
| 40% | 40.0% | 579,254 | 579,016 |
| 30% | 30.1% | 434,441 | 435,550 |
| 20% | 20.2% | 289,627 | 291,968 |
| 10% | 10.0% | 144,814 | 144,771 |
| Active Idle | 0 | 0 | |
| Target Load | Actual Load | ssj_ops | |
|---|---|---|---|
| Target | Actual | ||
| Calibration 1 | 1,438,380 | ||
| Calibration 2 | 1,436,741 | ||
| Calibration 3 | 1,437,877 | ||
| ssj_ops@calibrated=1,437,309 | |||
| 100% | 99.9% | 1,437,309 | 1,436,144 |
| 90% | 90.0% | 1,293,578 | 1,294,101 |
| 80% | 80.0% | 1,149,847 | 1,149,459 |
| 70% | 70.1% | 1,006,116 | 1,006,973 |
| 60% | 60.0% | 862,385 | 862,382 |
| 50% | 50.0% | 718,654 | 718,364 |
| 40% | 40.0% | 574,923 | 574,882 |
| 30% | 29.9% | 431,193 | 430,160 |
| 20% | 20.0% | 287,462 | 286,798 |
| 10% | 9.9% | 143,731 | 142,269 |
| Active Idle | 0 | 0 | |

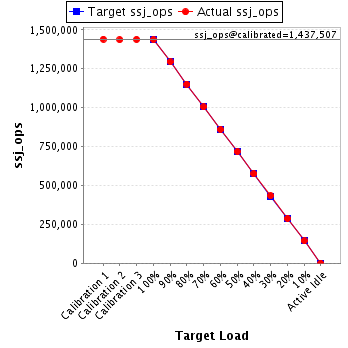
| Target Load | Actual Load | ssj_ops | |
|---|---|---|---|
| Target | Actual | ||
| Calibration 1 | 1,440,074 | ||
| Calibration 2 | 1,436,106 | ||
| Calibration 3 | 1,438,909 | ||
| ssj_ops@calibrated=1,437,507 | |||
| 100% | 100.0% | 1,437,507 | 1,437,299 |
| 90% | 90.0% | 1,293,757 | 1,293,827 |
| 80% | 80.1% | 1,150,006 | 1,151,546 |
| 70% | 69.9% | 1,006,255 | 1,004,361 |
| 60% | 59.8% | 862,504 | 859,879 |
| 50% | 49.9% | 718,754 | 717,466 |
| 40% | 40.0% | 575,003 | 574,441 |
| 30% | 30.1% | 431,252 | 432,970 |
| 20% | 19.9% | 287,501 | 286,489 |
| 10% | 10.0% | 143,751 | 143,601 |
| Active Idle | 0 | 0 | |
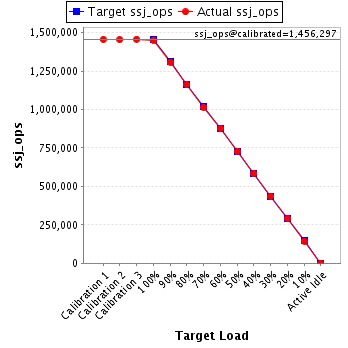
| Target Load | Actual Load | ssj_ops | |
|---|---|---|---|
| Target | Actual | ||
| Calibration 1 | 1,456,399 | ||
| Calibration 2 | 1,454,735 | ||
| Calibration 3 | 1,457,859 | ||
| ssj_ops@calibrated=1,456,297 | |||
| 100% | 99.5% | 1,456,297 | 1,449,646 |
| 90% | 89.8% | 1,310,667 | 1,308,196 |
| 80% | 79.9% | 1,165,038 | 1,163,023 |
| 70% | 69.8% | 1,019,408 | 1,015,843 |
| 60% | 60.1% | 873,778 | 875,802 |
| 50% | 50.0% | 728,148 | 728,800 |
| 40% | 40.0% | 582,519 | 582,509 |
| 30% | 30.0% | 436,889 | 437,316 |
| 20% | 19.9% | 291,259 | 289,881 |
| 10% | 9.9% | 145,630 | 144,630 |
| Active Idle | 0 | 0 | |
| Target Load | Actual Load | ssj_ops | |
|---|---|---|---|
| Target | Actual | ||
| Calibration 1 | 1,439,655 | ||
| Calibration 2 | 1,438,190 | ||
| Calibration 3 | 1,438,175 | ||
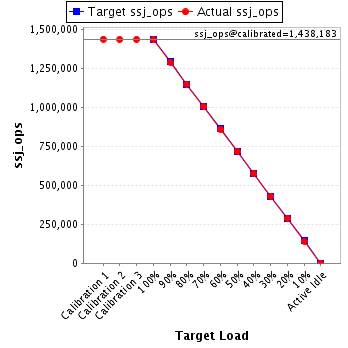
| ssj_ops@calibrated=1,438,183 | |||
| 100% | 99.8% | 1,438,183 | 1,434,969 |
| 90% | 89.9% | 1,294,364 | 1,292,703 |
| 80% | 80.1% | 1,150,546 | 1,151,292 |
| 70% | 69.9% | 1,006,728 | 1,005,823 |
| 60% | 59.9% | 862,910 | 861,859 |
| 50% | 50.0% | 719,091 | 719,524 |
| 40% | 40.0% | 575,273 | 575,464 |
| 30% | 30.0% | 431,455 | 431,473 |
| 20% | 20.1% | 287,637 | 288,891 |
| 10% | 9.9% | 143,818 | 142,254 |
| Active Idle | 0 | 0 | |
| Target Load | Actual Load | ssj_ops | |
|---|---|---|---|
| Target | Actual | ||
| Calibration 1 | 1,428,790 | ||
| Calibration 2 | 1,424,978 | ||
| Calibration 3 | 1,427,408 | ||
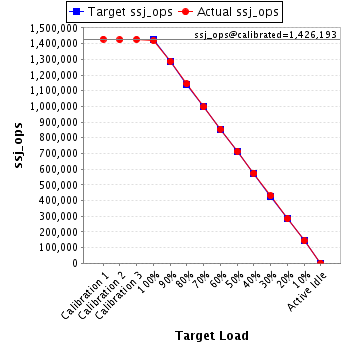
| ssj_ops@calibrated=1,426,193 | |||
| 100% | 99.5% | 1,426,193 | 1,419,265 |
| 90% | 90.3% | 1,283,574 | 1,287,473 |
| 80% | 80.2% | 1,140,954 | 1,143,459 |
| 70% | 69.9% | 998,335 | 996,584 |
| 60% | 60.0% | 855,716 | 855,942 |
| 50% | 50.0% | 713,096 | 713,152 |
| 40% | 40.2% | 570,477 | 573,566 |
| 30% | 30.1% | 427,858 | 429,369 |
| 20% | 19.9% | 285,239 | 283,764 |
| 10% | 10.1% | 142,619 | 143,912 |
| Active Idle | 0 | 0 | |