SPECpower_ssj2008
Host 'Node05' Performance Report
Copyright © 2007-2018 Standard Performance Evaluation Corporation
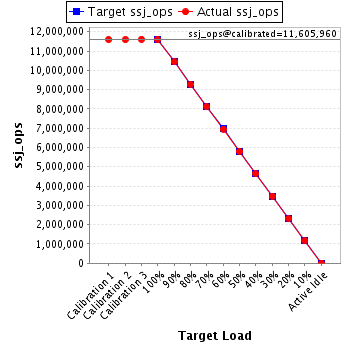
| Hewlett Packard Enterprise Synergy 660 Gen10 Compute Module | ssj_ops@100% = 11,585,227 ssj_ops@100% per JVM = 1,448,153 |
||||
| Test Sponsor: | Hewlett Packard Enterprise | SPEC License #: | 3 | Test Method: | Multi Node |
| Tested By: | Hewlett Packard Enterprise | Test Location: | Houston, TX, USA | Test Date: | Aug 28, 2018 |
| Hardware Availability: | Jun-2018 | Software Availability: | Mar-2018 | Publication: | Sep 12, 2018 |
| System Source: | Single Supplier | System Designation: | Server | Power Provisioning: | Line-powered |
| Target Load | Actual Load | ssj_ops | |
|---|---|---|---|
| Target | Actual | ||
| Calibration 1 | 11,600,074 | ||
| Calibration 2 | 11,595,575 | ||
| Calibration 3 | 11,616,345 | ||
| ssj_ops@calibrated=11,605,960 | |||
| 100% | 99.8% | 11,605,960 | 11,585,227 |
| 90% | 90.0% | 10,445,364 | 10,442,163 |
| 80% | 80.0% | 9,284,768 | 9,286,555 |
| 70% | 69.9% | 8,124,172 | 8,114,267 |
| 60% | 60.0% | 6,963,576 | 6,959,210 |
| 50% | 50.0% | 5,802,980 | 5,801,910 |
| 40% | 40.0% | 4,642,384 | 4,644,345 |
| 30% | 30.0% | 3,481,788 | 3,484,008 |
| 20% | 20.0% | 2,321,192 | 2,322,736 |
| 10% | 10.0% | 1,160,596 | 1,160,800 |
| Active Idle | 0 | 0 | |
| Set Identifier: | SUT |
| Set Description: | System Under Test |
| # of Identical Nodes: | 2 |
| Comment: | SUT |
| Hardware | |
|---|---|
| Hardware Vendor: | Hewlett Packard Enterprise |
| Model: | Synergy 660 Gen10 Compute Module |
| Form Factor: | Other |
| CPU Name: | Intel Xeon Platinum 8180 2.50GHz |
| CPU Characteristics: | 28-Core, 2.50 GHz, 38.5MB L3 Cache |
| CPU Frequency (MHz): | 2500 |
| CPU(s) Enabled: | 112 cores, 4 chips, 28 cores/chip |
| Hardware Threads: | 224 (2 / core) |
| CPU(s) Orderable: | 1,2,3,4 chips |
| Primary Cache: | 32 KB I + 32 KB D on chip per core |
| Secondary Cache: | 1 MB I+D on chip per core |
| Tertiary Cache: | 39424 KB I+D on chip per chip |
| Other Cache: | None |
| Memory Amount (GB): | 384 |
| # and size of DIMM: | 24 x 16384 MB |
| Memory Details: | 24 x 16GB 2Rx8 PC4-2666-V ECC; slots 1, 3, 5, 8, 10 and 12 populated on each CPU socket |
| Power Supply Quantity and Rating (W): | None |
| Power Supply Details: | Shared |
| Disk Drive: | 1 x HPE 480GB SATA 6G Read Intensive M.2 (875490-B21) |
| Disk Controller: | 1 x HPE Smart Array S100i SR Gen10 (784308-B21) |
| # and type of Network Interface Cards (NICs) Installed: | 1 x HPE Synergy 3820C 10/20Gb 2-port Converged Network Adapter (777430-B21) |
| NICs Enabled in Firmware / OS / Connected: | 2/1/1 |
| Network Speed (Mbit): | 10000 |
| Keyboard: | None |
| Mouse: | None |
| Monitor: | None |
| Optical Drives: | No |
| Other Hardware: | None |
| Software | |
|---|---|
| Power Management: | Enabled (see SUT Notes) |
| Operating System (OS): | Windows Server 2012 R2 Datacenter |
| OS Version: | Version 6.3 (Build 9600) |
| Filesystem: | NTFS |
| JVM Vendor: | Oracle Corporation |
| JVM Version: | Oracle Java HotSpot(TM) 64-Bit Server VM (build 24.80-b11, mixed mode), version 1.7.0_80 |
| JVM Command-line Options: | -server -Xmn19g -Xms21g -Xmx21g -XX:SurvivorRatio=1 -XX:TargetSurvivorRatio=99 -XX:AllocatePrefetchDistance=256 -XX:AllocatePrefetchLines=4 -XX:LoopUnrollLimit=30 -XX:InitialTenuringThreshold=12 -XX:MaxTenuringThreshold=15 -XX:ParallelGCThreads=28 -XX:InlineSmallCode=3900 -XX:MaxInlineSize=270 -XX:FreqInlineSize=2500 -XX:+AggressiveOpts -XX:+UseLargePages -XX:+UseParallelOldGC |
| JVM Affinity: | start /NODE [0,2,4,6] /AFFINITY [0x0000000FC0FF, 0xFC0FF0000000]; start /NODE [1,3,5,7] /AFFINITY [0x0000000FF03F,0xFF03F0000000] |
| JVM Instances: | 8 |
| JVM Initial Heap (MB): | 21000 |
| JVM Maximum Heap (MB): | 21000 |
| JVM Address Bits: | 64 |
| Boot Firmware Version: | I43 v1.32 (02/01/2018) |
| Management Firmware Version: | 1.15 August 17 2017 |
| Workload Version: | SSJ 1.2.10 |
| Director Location: | Controller |
| Other Software: | HPE Composer Version 3.10.07 (HPE OneView) with HPE Synergy Custom SPP Bundle 2017.10.20180323; Microsoft Windows KB4054519, KB4056898 |
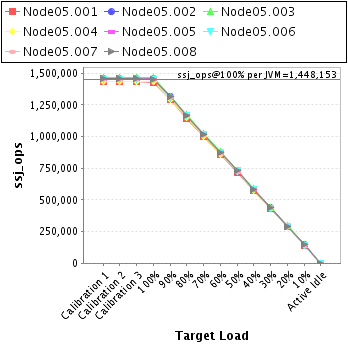
| JVM Instance | ssj_ops@100% |
|---|---|
| Node05.001 | 1,428,119 |
| Node05.002 | 1,457,307 |
| Node05.003 | 1,462,553 |
| Node05.004 | 1,432,013 |
| Node05.005 | 1,453,548 |
| Node05.006 | 1,449,340 |
| Node05.007 | 1,449,570 |
| Node05.008 | 1,452,779 |
| ssj_ops@100% | 11,585,227 |
| ssj_ops@100% per JVM | 1,448,153 |
| Target Load | Actual Load | ssj_ops | |
|---|---|---|---|
| Target | Actual | ||
| Calibration 1 | 1,431,342 | ||
| Calibration 2 | 1,430,754 | ||
| Calibration 3 | 1,433,507 | ||
| ssj_ops@calibrated=1,432,130 | |||
| 100% | 99.7% | 1,432,130 | 1,428,119 |
| 90% | 90.0% | 1,288,917 | 1,288,222 |
| 80% | 79.8% | 1,145,704 | 1,142,306 |
| 70% | 69.8% | 1,002,491 | 1,000,080 |
| 60% | 60.1% | 859,278 | 861,264 |
| 50% | 50.0% | 716,065 | 715,575 |
| 40% | 40.1% | 572,852 | 573,877 |
| 30% | 30.0% | 429,639 | 428,982 |
| 20% | 20.0% | 286,426 | 286,516 |
| 10% | 10.0% | 143,213 | 143,528 |
| Active Idle | 0 | 0 | |
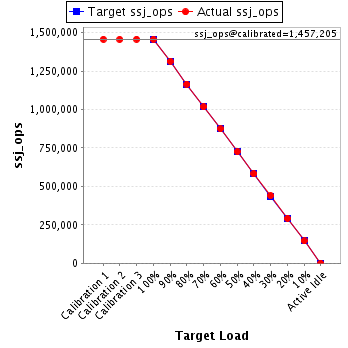
| Target Load | Actual Load | ssj_ops | |
|---|---|---|---|
| Target | Actual | ||
| Calibration 1 | 1,457,697 | ||
| Calibration 2 | 1,456,362 | ||
| Calibration 3 | 1,458,047 | ||
| ssj_ops@calibrated=1,457,205 | |||
| 100% | 100.0% | 1,457,205 | 1,457,307 |
| 90% | 90.2% | 1,311,484 | 1,314,520 |
| 80% | 80.0% | 1,165,764 | 1,165,484 |
| 70% | 69.8% | 1,020,043 | 1,017,131 |
| 60% | 60.0% | 874,323 | 873,887 |
| 50% | 49.8% | 728,602 | 725,637 |
| 40% | 39.9% | 582,882 | 581,688 |
| 30% | 30.1% | 437,161 | 439,273 |
| 20% | 20.1% | 291,441 | 292,398 |
| 10% | 10.0% | 145,720 | 145,144 |
| Active Idle | 0 | 0 | |
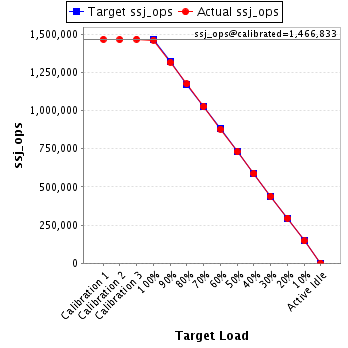
| Target Load | Actual Load | ssj_ops | |
|---|---|---|---|
| Target | Actual | ||
| Calibration 1 | 1,466,721 | ||
| Calibration 2 | 1,465,535 | ||
| Calibration 3 | 1,468,131 | ||
| ssj_ops@calibrated=1,466,833 | |||
| 100% | 99.7% | 1,466,833 | 1,462,553 |
| 90% | 89.7% | 1,320,150 | 1,315,912 |
| 80% | 80.1% | 1,173,466 | 1,174,847 |
| 70% | 70.0% | 1,026,783 | 1,026,883 |
| 60% | 60.0% | 880,100 | 879,459 |
| 50% | 49.8% | 733,417 | 730,583 |
| 40% | 40.0% | 586,733 | 586,633 |
| 30% | 29.9% | 440,050 | 439,284 |
| 20% | 20.2% | 293,367 | 296,348 |
| 10% | 10.0% | 146,683 | 146,406 |
| Active Idle | 0 | 0 | |
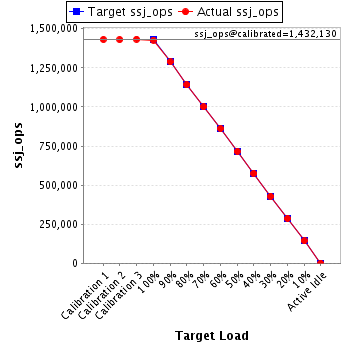
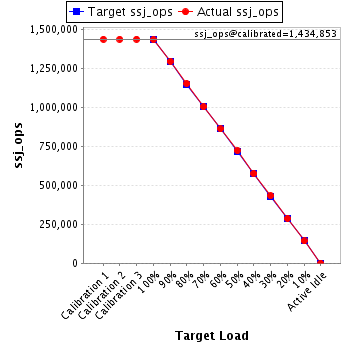
| Target Load | Actual Load | ssj_ops | |
|---|---|---|---|
| Target | Actual | ||
| Calibration 1 | 1,434,279 | ||
| Calibration 2 | 1,434,554 | ||
| Calibration 3 | 1,435,152 | ||
| ssj_ops@calibrated=1,434,853 | |||
| 100% | 99.8% | 1,434,853 | 1,432,013 |
| 90% | 90.1% | 1,291,368 | 1,292,988 |
| 80% | 80.2% | 1,147,882 | 1,151,353 |
| 70% | 69.9% | 1,004,397 | 1,002,691 |
| 60% | 59.9% | 860,912 | 860,155 |
| 50% | 50.3% | 717,426 | 721,700 |
| 40% | 40.0% | 573,941 | 573,745 |
| 30% | 30.1% | 430,456 | 431,372 |
| 20% | 20.0% | 286,971 | 286,608 |
| 10% | 10.0% | 143,485 | 142,952 |
| Active Idle | 0 | 0 | |
| Target Load | Actual Load | ssj_ops | |
|---|---|---|---|
| Target | Actual | ||
| Calibration 1 | 1,453,918 | ||
| Calibration 2 | 1,454,596 | ||
| Calibration 3 | 1,457,088 | ||
| ssj_ops@calibrated=1,455,842 | |||
| 100% | 99.8% | 1,455,842 | 1,453,548 |
| 90% | 89.8% | 1,310,258 | 1,307,685 |
| 80% | 80.2% | 1,164,674 | 1,167,121 |
| 70% | 70.0% | 1,019,089 | 1,018,883 |
| 60% | 60.0% | 873,505 | 872,965 |
| 50% | 50.0% | 727,921 | 727,533 |
| 40% | 39.8% | 582,337 | 579,819 |
| 30% | 30.0% | 436,753 | 436,966 |
| 20% | 20.1% | 291,168 | 292,135 |
| 10% | 10.1% | 145,584 | 147,420 |
| Active Idle | 0 | 0 | |

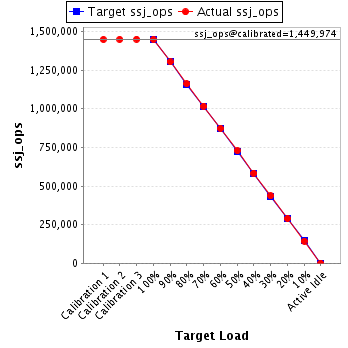
| Target Load | Actual Load | ssj_ops | |
|---|---|---|---|
| Target | Actual | ||
| Calibration 1 | 1,448,288 | ||
| Calibration 2 | 1,449,284 | ||
| Calibration 3 | 1,450,665 | ||
| ssj_ops@calibrated=1,449,974 | |||
| 100% | 100.0% | 1,449,974 | 1,449,340 |
| 90% | 89.9% | 1,304,977 | 1,303,865 |
| 80% | 80.2% | 1,159,980 | 1,162,191 |
| 70% | 70.2% | 1,014,982 | 1,017,842 |
| 60% | 60.3% | 869,985 | 873,638 |
| 50% | 50.2% | 724,987 | 727,973 |
| 40% | 40.2% | 579,990 | 583,042 |
| 30% | 30.0% | 434,992 | 435,576 |
| 20% | 19.9% | 289,995 | 288,701 |
| 10% | 9.9% | 144,997 | 143,612 |
| Active Idle | 0 | 0 | |
| Target Load | Actual Load | ssj_ops | |
|---|---|---|---|
| Target | Actual | ||
| Calibration 1 | 1,450,712 | ||
| Calibration 2 | 1,447,915 | ||
| Calibration 3 | 1,454,779 | ||
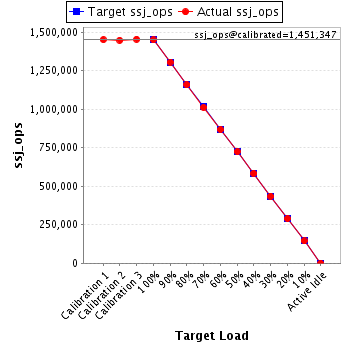
| ssj_ops@calibrated=1,451,347 | |||
| 100% | 99.9% | 1,451,347 | 1,449,570 |
| 90% | 90.0% | 1,306,213 | 1,306,173 |
| 80% | 79.8% | 1,161,078 | 1,158,639 |
| 70% | 69.7% | 1,015,943 | 1,011,707 |
| 60% | 59.8% | 870,808 | 867,360 |
| 50% | 49.9% | 725,674 | 723,853 |
| 40% | 40.1% | 580,539 | 582,336 |
| 30% | 30.0% | 435,404 | 435,722 |
| 20% | 19.9% | 290,269 | 289,134 |
| 10% | 10.0% | 145,135 | 144,628 |
| Active Idle | 0 | 0 | |
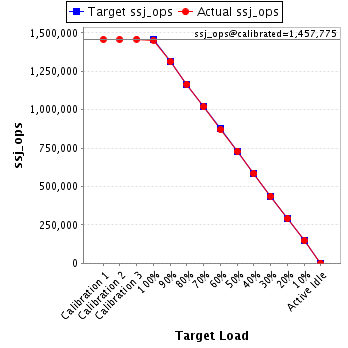
| Target Load | Actual Load | ssj_ops | |
|---|---|---|---|
| Target | Actual | ||
| Calibration 1 | 1,457,118 | ||
| Calibration 2 | 1,456,575 | ||
| Calibration 3 | 1,458,975 | ||
| ssj_ops@calibrated=1,457,775 | |||
| 100% | 99.7% | 1,457,775 | 1,452,779 |
| 90% | 90.1% | 1,311,998 | 1,312,799 |
| 80% | 79.9% | 1,166,220 | 1,164,615 |
| 70% | 69.9% | 1,020,443 | 1,019,049 |
| 60% | 59.7% | 874,665 | 870,481 |
| 50% | 50.0% | 728,888 | 729,055 |
| 40% | 40.0% | 583,110 | 583,204 |
| 30% | 30.0% | 437,333 | 436,834 |
| 20% | 20.0% | 291,555 | 290,895 |
| 10% | 10.1% | 145,778 | 147,110 |
| Active Idle | 0 | 0 | |