SPECpower_ssj2008
Host 'WIN-GK3QN9IB8SA' Performance Report
Copyright © 2007-2018 Standard Performance Evaluation Corporation
| Quanta Computer Inc. QuantaGrid D52BQ-2U | ssj_ops@100% = 5,604,059 ssj_ops@100% per JVM = 1,401,015 |
||||
| Test Sponsor: | Quanta Computer Inc. | SPEC License #: | 9050 | Test Method: | Single Node |
| Tested By: | Quanta Computer Inc. | Test Location: | Taoyuan, TW, R.O.C | Test Date: | Oct 25, 2018 |
| Hardware Availability: | Sep-2018 | Software Availability: | Oct-2018 | Publication: | Dec 6, 2018 |
| System Source: | Single Supplier | System Designation: | Server | Power Provisioning: | Line-powered |
| Target Load | Actual Load | ssj_ops | |
|---|---|---|---|
| Target | Actual | ||
| Calibration 1 | 5,737,367 | ||
| Calibration 2 | 5,676,060 | ||
| Calibration 3 | 5,680,318 | ||
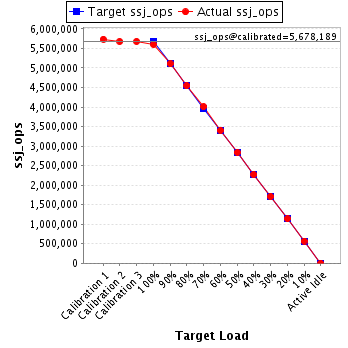
| ssj_ops@calibrated=5,678,189 | |||
| 100% | 98.7% | 5,678,189 | 5,604,059 |
| 90% | 90.0% | 5,110,370 | 5,108,634 |
| 80% | 80.1% | 4,542,551 | 4,547,717 |
| 70% | 70.6% | 3,974,732 | 4,009,909 |
| 60% | 60.0% | 3,406,913 | 3,405,442 |
| 50% | 50.0% | 2,839,094 | 2,838,514 |
| 40% | 39.9% | 2,271,276 | 2,268,290 |
| 30% | 30.0% | 1,703,457 | 1,705,232 |
| 20% | 20.0% | 1,135,638 | 1,135,504 |
| 10% | 10.0% | 567,819 | 569,455 |
| Active Idle | 0 | 0 | |
| Set Identifier: | S5BQ |
| Set Description: | System Under Test |
| # of Identical Nodes: | 1 |
| Comment: | None |
| Hardware | |
|---|---|
| Hardware Vendor: | Quanta Computer Inc. |
| Model: | QuantaGrid D52BQ-2U |
| Form Factor: | 2U |
| CPU Name: | Intel Xeon Platinum 8180 2.50 GHz (Intel Turbo Boost Technology up to 3.8GHz) |
| CPU Characteristics: | 28 core, 2.5GHz, 38.5MB L3 Cache |
| CPU Frequency (MHz): | 2500 |
| CPU(s) Enabled: | 56 cores, 2 chips, 28 cores/chip |
| Hardware Threads: | 112 (2 / core) |
| CPU(s) Orderable: | 1,2 chips |
| Primary Cache: | 32 KB I + 32 KB D on chip per core |
| Secondary Cache: | 1 MB I+D on chip per chip |
| Tertiary Cache: | 39424 KB I+D off chip per chip |
| Other Cache: | None |
| Memory Amount (GB): | 96 |
| # and size of DIMM: | 12 x 8 GB |
| Memory Details: | 8GB 1Rx8 PC4-2666V-RD1-11-PA0; slots A0, B0, C0, D0, E0, F0, populated |
| Power Supply Quantity and Rating (W): | 1 x 800 |
| Power Supply Details: | Murata MPS8146 |
| Disk Drive: | 1 x 120G SATA SSD Quanta P/N:ABS08120000 |
| Disk Controller: | Integrated SATA controller |
| # and type of Network Interface Cards (NICs) Installed: | 1 x Quanta Ethernet Controller I350-T2, 2-port |
| NICs Enabled in Firmware / OS / Connected: | 1/1/1 |
| Network Speed (Mbit): | 1000 |
| Keyboard: | None |
| Mouse: | None |
| Monitor: | None |
| Optical Drives: | No |
| Other Hardware: | None |
| Software | |
|---|---|
| Power Management: | Balanced power plan in OS |
| Operating System (OS): | Microsoft Windows Server 2012 R2 Datacenter |
| OS Version: | Version 6.3.9600 (Build 9600) |
| Filesystem: | NTFS |
| JVM Vendor: | Oracle Corporation |
| JVM Version: | Oracle HotSpot(TM) 64-Bit Server VM (build 24.80-b11, mixed mode), version 1.7.0_80 |
| JVM Command-line Options: | -server -Xmn19000m -Xms21000m -Xmx21000m -XX:SurvivorRatio=1 -XX:TargetSurvivorRatio=99 -XX:AllocatePrefetchDistance=256 -XX:AllocatePrefetchLines=4 -XX:LoopUnrollLimit=45 -XX:InitialTenuringThreshold=12 -XX:MaxTenuringThreshold=15 -XX:ParallelGCThreads=28 -XX:InlineSmallCode=3900 -XX:MaxInlineSize=270 -XX:FreqInlineSize=2500 -XX:+AggressiveOpts -XX:+UseLargePages -XX:+UseParallelOldGC |
| JVM Affinity: | start /NODE [0,1,2,3] /AFFINITY [0xffffffffffffff] |
| JVM Instances: | 4 |
| JVM Initial Heap (MB): | 21000 |
| JVM Maximum Heap (MB): | 21000 |
| JVM Address Bits: | 64 |
| Boot Firmware Version: | 3A12.Q302 |
| Management Firmware Version: | 3.85 |
| Workload Version: | SSJ 1.2.10 |
| Director Location: | Controller |
| Other Software: | Updates 2K12 R2 KB4462926 Monthly Rollup for mitigation patches |
| JVM Instance | ssj_ops@100% |
|---|---|
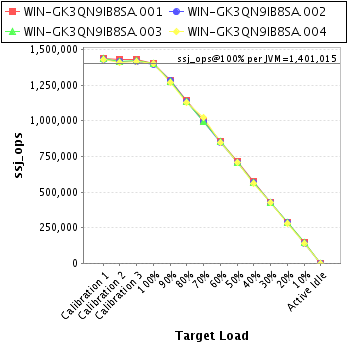
| WIN-GK3QN9IB8SA.001 | 1,405,182 |
| WIN-GK3QN9IB8SA.002 | 1,396,218 |
| WIN-GK3QN9IB8SA.003 | 1,403,018 |
| WIN-GK3QN9IB8SA.004 | 1,399,642 |
| ssj_ops@100% | 5,604,059 |
| ssj_ops@100% per JVM | 1,401,015 |
| Target Load | Actual Load | ssj_ops | |
|---|---|---|---|
| Target | Actual | ||
| Calibration 1 | 1,439,604 | ||
| Calibration 2 | 1,427,311 | ||
| Calibration 3 | 1,426,883 | ||
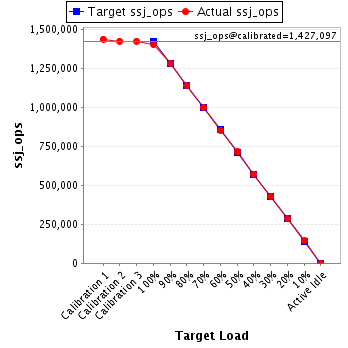
| ssj_ops@calibrated=1,427,097 | |||
| 100% | 98.5% | 1,427,097 | 1,405,182 |
| 90% | 90.0% | 1,284,388 | 1,284,371 |
| 80% | 80.1% | 1,141,678 | 1,143,027 |
| 70% | 70.1% | 998,968 | 1,001,006 |
| 60% | 59.9% | 856,258 | 855,470 |
| 50% | 50.1% | 713,549 | 715,223 |
| 40% | 40.0% | 570,839 | 570,989 |
| 30% | 30.1% | 428,129 | 429,308 |
| 20% | 20.0% | 285,419 | 285,316 |
| 10% | 10.1% | 142,710 | 143,559 |
| Active Idle | 0 | 0 | |
| Target Load | Actual Load | ssj_ops | |
|---|---|---|---|
| Target | Actual | ||
| Calibration 1 | 1,433,547 | ||
| Calibration 2 | 1,419,553 | ||
| Calibration 3 | 1,415,887 | ||
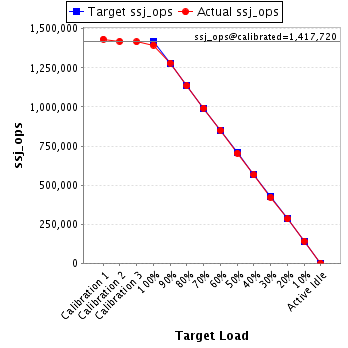
| ssj_ops@calibrated=1,417,720 | |||
| 100% | 98.5% | 1,417,720 | 1,396,218 |
| 90% | 90.4% | 1,275,948 | 1,281,085 |
| 80% | 80.1% | 1,134,176 | 1,135,612 |
| 70% | 70.0% | 992,404 | 992,507 |
| 60% | 60.0% | 850,632 | 851,166 |
| 50% | 49.7% | 708,860 | 704,062 |
| 40% | 39.8% | 567,088 | 564,873 |
| 30% | 29.9% | 425,316 | 423,198 |
| 20% | 20.0% | 283,544 | 283,495 |
| 10% | 10.0% | 141,772 | 141,945 |
| Active Idle | 0 | 0 | |
| Target Load | Actual Load | ssj_ops | |
|---|---|---|---|
| Target | Actual | ||
| Calibration 1 | 1,434,118 | ||
| Calibration 2 | 1,417,820 | ||
| Calibration 3 | 1,420,316 | ||
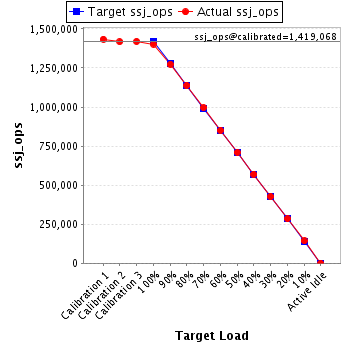
| ssj_ops@calibrated=1,419,068 | |||
| 100% | 98.9% | 1,419,068 | 1,403,018 |
| 90% | 89.7% | 1,277,161 | 1,272,615 |
| 80% | 80.2% | 1,135,254 | 1,138,659 |
| 70% | 70.1% | 993,347 | 995,044 |
| 60% | 60.0% | 851,441 | 851,490 |
| 50% | 50.0% | 709,534 | 709,498 |
| 40% | 40.1% | 567,627 | 569,371 |
| 30% | 30.0% | 425,720 | 426,301 |
| 20% | 20.0% | 283,814 | 284,300 |
| 10% | 10.1% | 141,907 | 142,874 |
| Active Idle | 0 | 0 | |
| Target Load | Actual Load | ssj_ops | |
|---|---|---|---|
| Target | Actual | ||
| Calibration 1 | 1,430,098 | ||
| Calibration 2 | 1,411,375 | ||
| Calibration 3 | 1,417,232 | ||
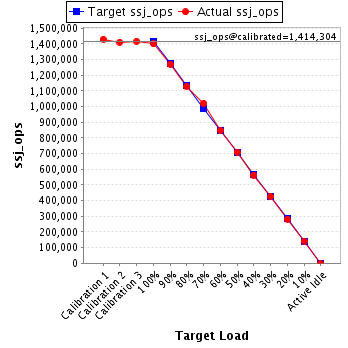
| ssj_ops@calibrated=1,414,304 | |||
| 100% | 99.0% | 1,414,304 | 1,399,642 |
| 90% | 89.8% | 1,272,873 | 1,270,563 |
| 80% | 79.9% | 1,131,443 | 1,130,419 |
| 70% | 72.2% | 990,013 | 1,021,351 |
| 60% | 59.9% | 848,582 | 847,315 |
| 50% | 50.2% | 707,152 | 709,730 |
| 40% | 39.8% | 565,721 | 563,057 |
| 30% | 30.2% | 424,291 | 426,426 |
| 20% | 20.0% | 282,861 | 282,393 |
| 10% | 10.0% | 141,430 | 141,077 |
| Active Idle | 0 | 0 | |