SPECpower_ssj2008
Aggregate Performance Report
Copyright © 2007-2019 Standard Performance Evaluation Corporation
| Hewlett Packard Enterprise Synergy 660 Gen10 Compute Module | ssj_ops@100% = 34,413,035 ssj_ops@100% per Host = 11,471,012 ssj_ops@100% per JVM = 1,433,876 |
||||
| Test Sponsor: | Hewlett Packard Enterprise | SPEC License #: | 3 | Test Method: | Multi Node |
| Tested By: | Hewlett Packard Enterprise | Test Location: | Houston, TX, USA | Test Date: | Mar 10, 2019 |
| Hardware Availability: | Apr-2019 | Software Availability: | Mar-2019 | Publication: | Apr 2, 2019 |
| System Source: | Single Supplier | System Designation: | Server | Power Provisioning: | Line-powered |
| Target Load | Actual Load | ssj_ops | |
|---|---|---|---|
| Target | Actual | ||
| Calibration 1 | 34,530,850 | ||
| Calibration 2 | 34,486,164 | ||
| Calibration 3 | 34,517,664 | ||
| ssj_ops@calibrated=34,501,914 | |||
| 100% | 99.7% | 34,501,914 | 34,413,035 |
| 90% | 90.0% | 31,051,723 | 31,050,761 |
| 80% | 80.0% | 27,601,531 | 27,586,963 |
| 70% | 70.0% | 24,151,340 | 24,148,606 |
| 60% | 60.0% | 20,701,148 | 20,694,346 |
| 50% | 50.0% | 17,250,957 | 17,252,065 |
| 40% | 40.0% | 13,800,766 | 13,800,468 |
| 30% | 30.0% | 10,350,574 | 10,347,613 |
| 20% | 20.0% | 6,900,383 | 6,909,860 |
| 10% | 10.0% | 3,450,191 | 3,446,785 |
| Active Idle | 0 | 0 | |

| # of Nodes | # of Chips | # of Cores | # of Threads | Total RAM (GB) | # of OS Images | # of JVM Instances |
|---|---|---|---|---|---|---|
| 3 | 12 | 336 | 672 | 1,152 | 3 | 24 |
| Set Identifier: | SUT |
| Set Description: | System Under Test |
| # of Identical Nodes: | 3 |
| Comment: | SUT |
| Hardware per Node | |
|---|---|
| Hardware Vendor: | Hewlett Packard Enterprise |
| Model: | Synergy 660 Gen10 Compute Module |
| Form Factor: | blade |
| CPU Name: | Intel Xeon Platinum 8280 @ 2.70GHz (Intel Turbo Boost Technology up to 4.00 GHz) |
| CPU Characteristics: | 28-Core, 2.70 GHz, 38.5MB L3 Cache |
| CPU Frequency (MHz): | 2700 |
| CPU(s) Enabled: | 112 cores, 4 chips, 28 cores/chip |
| Hardware Threads: | 224 (2 / core) |
| CPU(s) Orderable: | 1,2,3,4 chips |
| Primary Cache: | 32 KB I + 32 KB D on chip per core |
| Secondary Cache: | 1 MB I+D on chip per core |
| Tertiary Cache: | 39424 KB I+D on chip per chip |
| Other Cache: | None |
| Memory Amount (GB): | 384 |
| # and size of DIMM: | 24 x 16384 MB |
| Memory Details: | 24 x 16GB 2Rx8 PC4-2933Y-R; slots 1, 3, 5, 8, 10 and 12 populated on each socket |
| Power Supply Quantity and Rating (W): | None |
| Power Supply Details: | N/A |
| Disk Drive: | 1 x HPE 480GB SATA 6G M.2 2280 (875498-B21) |
| Disk Controller: | HPE Smart Array S100i SR Gen10 |
| # and type of Network Interface Cards (NICs) Installed: | 1 x HPE Synergy 3820C 10/20Gb CNA |
| NICs Enabled in Firmware / OS / Connected: | 2/2/1 |
| Network Speed (Mbit): | 1000 |
| Keyboard: | None |
| Mouse: | None |
| Monitor: | None |
| Optical Drives: | No |
| Other Hardware: | None |
| Software per Node | |
|---|---|
| Power Management: | Enabled (see SUT Notes) |
| Operating System (OS): | Windows Server 2012 R2 Datacenter |
| OS Version: | Version 6.3 (Build 9600) |
| Filesystem: | NTFS |
| JVM Vendor: | Oracle Corporation |
| JVM Version: | Oracle Java HotSpot(TM) 64-Bit Server VM (build 24.80-b11, mixed mode), version 1.7.0_80 |
| JVM Command-line Options: | -server -Xmn19000m -Xms21000m -Xmx21000m -XX:SurvivorRatio=1 -XX:TargetSurvivorRatio=99 -XX:AllocatePrefetchDistance=256 -XX:AllocatePrefetchLines=4 -XX:LoopUnrollLimit=45 -XX:InitialTenuringThreshold=12 -XX:MaxTenuringThreshold=15 -XX:ParallelGCThreads=28 -XX:InlineSmallCode=3900 -XX:MaxInlineSize=270 -XX:FreqInlineSize=2500 -XX:+AggressiveOpts -XX:+UseLargePages -XX:+UseParallelOldGC |
| JVM Affinity: | start /NODE [0,1,2,3] /AFFINITY [0xFFFFFFF] |
| JVM Instances: | 8 |
| JVM Initial Heap (MB): | 21000 |
| JVM Maximum Heap (MB): | 21000 |
| JVM Address Bits: | 64 |
| Boot Firmware Version: | I43 v2.10 (01/18/2019) |
| Management Firmware Version: | 1.40 Feb 05 2019 |
| Workload Version: | SSJ 1.2.10 |
| Director Location: | Controller |
| Other Software: | HPE Service Pack for ProLiant (SPP) - Version 2019.03.0 (Mar 2019), Microsoft Windows KB4054519, and KB4056898 |
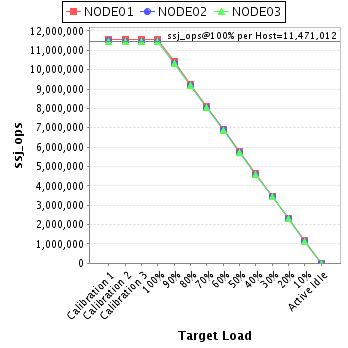
| Host | ssj_ops@100% |
|---|---|
| NODE01 | 11,537,841 |
| NODE02 | 11,438,023 |
| NODE03 | 11,437,170 |
| ssj_ops@100% | 34,413,035 |
| ssj_ops@100% per Host | 11,471,012 |
| ssj_ops@100% per JVM | 1,433,876 |
| Target Load | Actual Load | ssj_ops | |
|---|---|---|---|
| Target | Actual | ||
| Calibration 1 | 11,577,476 | ||
| Calibration 2 | 11,562,720 | ||
| Calibration 3 | 11,570,612 | ||
| ssj_ops@calibrated=11,566,666 | |||
| 100% | 99.8% | 11,566,666 | 11,537,841 |
| 90% | 90.0% | 10,409,999 | 10,412,643 |
| 80% | 79.9% | 9,253,333 | 9,247,465 |
| 70% | 70.0% | 8,096,666 | 8,095,127 |
| 60% | 59.9% | 6,940,000 | 6,931,516 |
| 50% | 50.0% | 5,783,333 | 5,781,245 |
| 40% | 40.0% | 4,626,666 | 4,631,188 |
| 30% | 30.0% | 3,470,000 | 3,472,650 |
| 20% | 20.0% | 2,313,333 | 2,314,369 |
| 10% | 10.0% | 1,156,667 | 1,156,453 |
| Active Idle | 0 | 0 | |

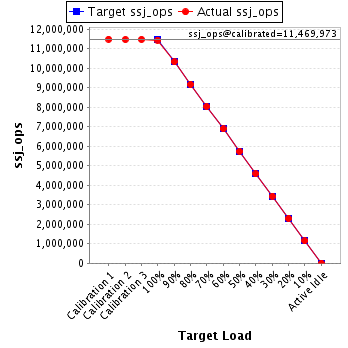
| Target Load | Actual Load | ssj_ops | |
|---|---|---|---|
| Target | Actual | ||
| Calibration 1 | 11,482,843 | ||
| Calibration 2 | 11,465,499 | ||
| Calibration 3 | 11,474,448 | ||
| ssj_ops@calibrated=11,469,973 | |||
| 100% | 99.7% | 11,469,973 | 11,438,023 |
| 90% | 90.0% | 10,322,976 | 10,317,845 |
| 80% | 79.9% | 9,175,979 | 9,167,460 |
| 70% | 70.0% | 8,028,981 | 8,029,900 |
| 60% | 60.0% | 6,881,984 | 6,885,214 |
| 50% | 50.0% | 5,734,987 | 5,739,957 |
| 40% | 39.9% | 4,587,989 | 4,581,602 |
| 30% | 30.0% | 3,440,992 | 3,441,139 |
| 20% | 20.1% | 2,293,995 | 2,301,551 |
| 10% | 10.0% | 1,146,997 | 1,145,416 |
| Active Idle | 0 | 0 | |
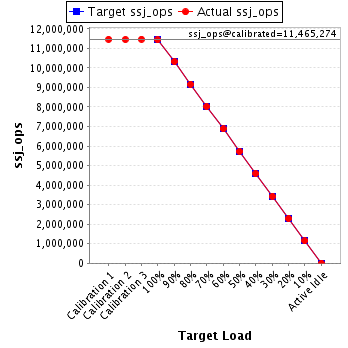
| Target Load | Actual Load | ssj_ops | |
|---|---|---|---|
| Target | Actual | ||
| Calibration 1 | 11,470,531 | ||
| Calibration 2 | 11,457,945 | ||
| Calibration 3 | 11,472,604 | ||
| ssj_ops@calibrated=11,465,274 | |||
| 100% | 99.8% | 11,465,274 | 11,437,170 |
| 90% | 90.0% | 10,318,747 | 10,320,273 |
| 80% | 80.0% | 9,172,220 | 9,172,038 |
| 70% | 70.0% | 8,025,692 | 8,023,579 |
| 60% | 60.0% | 6,879,165 | 6,877,617 |
| 50% | 50.0% | 5,732,637 | 5,730,863 |
| 40% | 40.0% | 4,586,110 | 4,587,678 |
| 30% | 29.9% | 3,439,582 | 3,433,824 |
| 20% | 20.0% | 2,293,055 | 2,293,939 |
| 10% | 10.0% | 1,146,527 | 1,144,916 |
| Active Idle | 0 | 0 | |