
SPECpower_ssj2008
Host 'WIN-GK3QN9IB8SA' Performance Report
Copyright © 2007-2019 Standard Performance Evaluation Corporation
| Quanta Computer Inc. QuantaGrid D52BQ-2U | ssj_ops@100% = 5,853,181 ssj_ops@100% per JVM = 1,463,295 |
||||
| Test Sponsor: | Quanta Computer Inc. | SPEC License #: | 9050 | Test Method: | Single Node |
| Tested By: | Quanta Computer Inc. | Test Location: | Taoyuan, TW, R.O.C | Test Date: | Mar 12, 2019 |
| Hardware Availability: | Apr-2019 | Software Availability: | Oct-2018 | Publication: | Apr 2, 2019 |
| System Source: | Single Supplier | System Designation: | Server | Power Provisioning: | Line-powered |
| Target Load | Actual Load | ssj_ops | |
|---|---|---|---|
| Target | Actual | ||
| Calibration 1 | 5,885,731 | ||
| Calibration 2 | 5,887,105 | ||
| Calibration 3 | 5,864,780 | ||
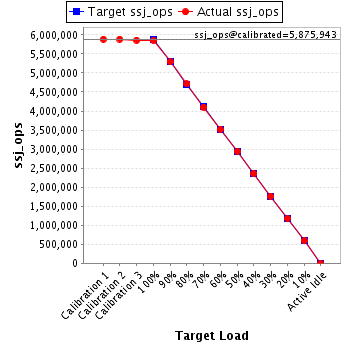
| ssj_ops@calibrated=5,875,943 | |||
| 100% | 99.6% | 5,875,943 | 5,853,181 |
| 90% | 90.0% | 5,288,348 | 5,288,335 |
| 80% | 80.2% | 4,700,754 | 4,709,622 |
| 70% | 69.8% | 4,113,160 | 4,104,168 |
| 60% | 59.9% | 3,525,566 | 3,521,417 |
| 50% | 50.0% | 2,937,971 | 2,939,819 |
| 40% | 40.0% | 2,350,377 | 2,352,773 |
| 30% | 30.0% | 1,762,783 | 1,765,601 |
| 20% | 20.1% | 1,175,189 | 1,178,507 |
| 10% | 10.1% | 587,594 | 591,393 |
| Active Idle | 0 | 0 | |
| Set Identifier: | D52BQ-2U |
| Set Description: | System Under Test |
| # of Identical Nodes: | 1 |
| Comment: | None |
| Hardware | |
|---|---|
| Hardware Vendor: | Quanta Computer Inc. |
| Model: | QuantaGrid D52BQ-2U |
| Form Factor: | 2U |
| CPU Name: | Intel Xeon Platinum 8280L 2.70 GHz |
| CPU Characteristics: | 28 core, 2.70GHz, 38.5MB L3 Cache |
| CPU Frequency (MHz): | 2700 |
| CPU(s) Enabled: | 56 cores, 2 chips, 28 cores/chip |
| Hardware Threads: | 112 (2 / core) |
| CPU(s) Orderable: | 1,2 chips |
| Primary Cache: | 32 KB I + 32 KB D on chip per core |
| Secondary Cache: | 1 MB I+D on chip per chip |
| Tertiary Cache: | 39424 KB I+D on chip per chip |
| Other Cache: | None |
| Memory Amount (GB): | 96 |
| # and size of DIMM: | 12 x 8 GB |
| Memory Details: | 8GB 1Rx8 PC4-2666V-RD1-12-MA0; slots A0, B0, C0, D0, E0, F0, populated for both Processor sockets |
| Power Supply Quantity and Rating (W): | 1 x 800 |
| Power Supply Details: | ARTESYN MC800B6-3-4R-02 |
| Disk Drive: | 1 x 240G SATA SSD,Quanta P/N ABSAK240000 |
| Disk Controller: | Integrated SATA controller |
| # and type of Network Interface Cards (NICs) Installed: | 1 x Quanta Ethernet Controller I350-T2, 2-port |
| NICs Enabled in Firmware / OS / Connected: | 2/2/1 |
| Network Speed (Mbit): | 1000 |
| Keyboard: | None |
| Mouse: | None |
| Monitor: | None |
| Optical Drives: | No |
| Other Hardware: | None |
| Software | |
|---|---|
| Power Management: | Balanced power plan in OS |
| Operating System (OS): | Microsoft Windows Server 2012 R2 Datacenter |
| OS Version: | Version 6.3.9600 (Build 9600) |
| Filesystem: | NTFS |
| JVM Vendor: | Oracle Corporation |
| JVM Version: | Oracle HotSpot(TM) 64-Bit Server VM (build 24.80-b11, mixed mode), version 1.7.0_80 |
| JVM Command-line Options: | -server -Xmn19000m -Xms21000m -Xmx21000m -XX:SurvivorRatio=1 -XX:TargetSurvivorRatio=99 -XX:AllocatePrefetchDistance=256 -XX:AllocatePrefetchLines=4 -XX:LoopUnrollLimit=45 -XX:InitialTenuringThreshold=12 -XX:MaxTenuringThreshold=15 -XX:ParallelGCThreads=28 -XX:InlineSmallCode=3900 -XX:MaxInlineSize=270 -XX:FreqInlineSize=2500 -XX:+AggressiveOpts -XX:+UseLargePages -XX:+UseParallelOldGC |
| JVM Affinity: | start /NODE [0,1,2,3] /AFFINITY [0xFFFFFFFFFFFFFF] |
| JVM Instances: | 4 |
| JVM Initial Heap (MB): | 21000 |
| JVM Maximum Heap (MB): | 21000 |
| JVM Address Bits: | 64 |
| Boot Firmware Version: | 3B12 |
| Management Firmware Version: | 4.55 |
| Workload Version: | SSJ 1.2.10 |
| Director Location: | Controller |
| Other Software: | Updates 2K12 R2 KB4462926 Monthly Rollup for mitigation patches |
| JVM Instance | ssj_ops@100% |
|---|---|
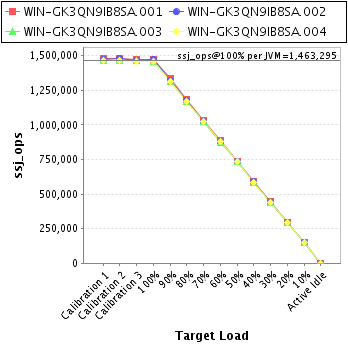
| WIN-GK3QN9IB8SA.001 | 1,470,192 |
| WIN-GK3QN9IB8SA.002 | 1,470,983 |
| WIN-GK3QN9IB8SA.003 | 1,455,454 |
| WIN-GK3QN9IB8SA.004 | 1,456,552 |
| ssj_ops@100% | 5,853,181 |
| ssj_ops@100% per JVM | 1,463,295 |
| Target Load | Actual Load | ssj_ops | |
|---|---|---|---|
| Target | Actual | ||
| Calibration 1 | 1,482,622 | ||
| Calibration 2 | 1,482,153 | ||
| Calibration 3 | 1,473,111 | ||
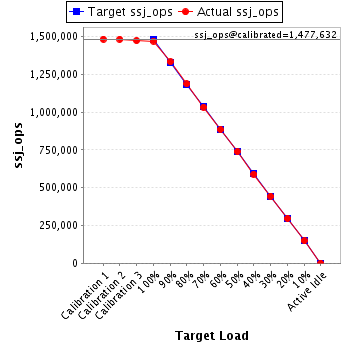
| ssj_ops@calibrated=1,477,632 | |||
| 100% | 99.5% | 1,477,632 | 1,470,192 |
| 90% | 90.2% | 1,329,869 | 1,333,213 |
| 80% | 80.3% | 1,182,105 | 1,187,012 |
| 70% | 69.9% | 1,034,342 | 1,033,529 |
| 60% | 59.9% | 886,579 | 885,282 |
| 50% | 50.0% | 738,816 | 738,604 |
| 40% | 39.9% | 591,053 | 590,010 |
| 30% | 30.0% | 443,290 | 444,027 |
| 20% | 20.1% | 295,526 | 296,482 |
| 10% | 10.1% | 147,763 | 148,569 |
| Active Idle | 0 | 0 | |
| Target Load | Actual Load | ssj_ops | |
|---|---|---|---|
| Target | Actual | ||
| Calibration 1 | 1,474,060 | ||
| Calibration 2 | 1,477,560 | ||
| Calibration 3 | 1,467,523 | ||
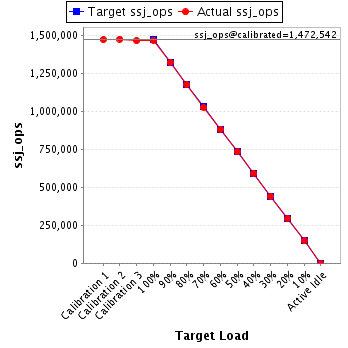
| ssj_ops@calibrated=1,472,542 | |||
| 100% | 99.9% | 1,472,542 | 1,470,983 |
| 90% | 89.9% | 1,325,287 | 1,324,177 |
| 80% | 80.0% | 1,178,033 | 1,177,819 |
| 70% | 69.8% | 1,030,779 | 1,027,786 |
| 60% | 60.0% | 883,525 | 883,370 |
| 50% | 49.9% | 736,271 | 734,125 |
| 40% | 40.2% | 589,017 | 591,418 |
| 30% | 30.0% | 441,762 | 441,927 |
| 20% | 20.1% | 294,508 | 295,549 |
| 10% | 10.1% | 147,254 | 148,334 |
| Active Idle | 0 | 0 | |
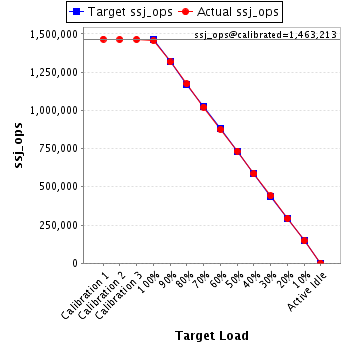
| Target Load | Actual Load | ssj_ops | |
|---|---|---|---|
| Target | Actual | ||
| Calibration 1 | 1,465,264 | ||
| Calibration 2 | 1,463,437 | ||
| Calibration 3 | 1,462,990 | ||
| ssj_ops@calibrated=1,463,213 | |||
| 100% | 99.5% | 1,463,213 | 1,455,454 |
| 90% | 89.9% | 1,316,892 | 1,315,998 |
| 80% | 80.2% | 1,170,571 | 1,173,027 |
| 70% | 69.8% | 1,024,249 | 1,021,533 |
| 60% | 59.8% | 877,928 | 875,177 |
| 50% | 50.1% | 731,607 | 733,510 |
| 40% | 40.0% | 585,285 | 584,708 |
| 30% | 30.1% | 438,964 | 439,820 |
| 20% | 20.1% | 292,643 | 293,526 |
| 10% | 10.0% | 146,321 | 146,806 |
| Active Idle | 0 | 0 | |
| Target Load | Actual Load | ssj_ops | |
|---|---|---|---|
| Target | Actual | ||
| Calibration 1 | 1,463,785 | ||
| Calibration 2 | 1,463,956 | ||
| Calibration 3 | 1,461,157 | ||
| ssj_ops@calibrated=1,462,556 | |||
| 100% | 99.6% | 1,462,556 | 1,456,552 |
| 90% | 89.9% | 1,316,301 | 1,314,947 |
| 80% | 80.1% | 1,170,045 | 1,171,764 |
| 70% | 69.8% | 1,023,789 | 1,021,320 |
| 60% | 60.0% | 877,534 | 877,587 |
| 50% | 50.2% | 731,278 | 733,580 |
| 40% | 40.1% | 585,022 | 586,638 |
| 30% | 30.1% | 438,767 | 439,826 |
| 20% | 20.0% | 292,511 | 292,949 |
| 10% | 10.1% | 146,256 | 147,684 |
| Active Idle | 0 | 0 | |
