SPECpower_ssj2008
Host 'NODE02' Performance Report
Copyright © 2007-2019 Standard Performance Evaluation Corporation
| Hewlett Packard Enterprise Synergy 480 Gen10 Compute Module | ssj_ops@100% = 5,721,194 ssj_ops@100% per JVM = 1,430,299 |
||||
| Test Sponsor: | Hewlett Packard Enterprise | SPEC License #: | 3 | Test Method: | Multi Node |
| Tested By: | Hewlett Packard Enterprise | Test Location: | Houston, TX, USA | Test Date: | Mar 27, 2019 |
| Hardware Availability: | Apr-2019 | Software Availability: | Mar-2019 | Publication: | May 8, 2019 |
| System Source: | Single Supplier | System Designation: | Server | Power Provisioning: | Line-powered |
| Target Load | Actual Load | ssj_ops | |
|---|---|---|---|
| Target | Actual | ||
| Calibration 1 | 5,747,211 | ||
| Calibration 2 | 5,734,091 | ||
| Calibration 3 | 5,740,894 | ||
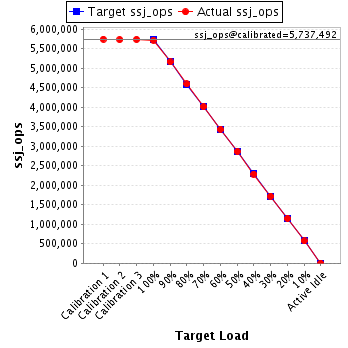
| ssj_ops@calibrated=5,737,492 | |||
| 100% | 99.7% | 5,737,492 | 5,721,194 |
| 90% | 90.0% | 5,163,743 | 5,162,835 |
| 80% | 80.1% | 4,589,994 | 4,597,866 |
| 70% | 70.0% | 4,016,245 | 4,013,380 |
| 60% | 59.9% | 3,442,495 | 3,439,045 |
| 50% | 50.0% | 2,868,746 | 2,867,781 |
| 40% | 39.9% | 2,294,997 | 2,288,516 |
| 30% | 30.0% | 1,721,248 | 1,723,177 |
| 20% | 20.0% | 1,147,498 | 1,149,361 |
| 10% | 10.0% | 573,749 | 571,898 |
| Active Idle | 0 | 0 | |
| Set Identifier: | SUT |
| Set Description: | System Under Test |
| # of Identical Nodes: | 5 |
| Comment: | SUT |
| Hardware | |
|---|---|
| Hardware Vendor: | Hewlett Packard Enterprise |
| Model: | Synergy 480 Gen10 Compute Module |
| Form Factor: | 7U |
| CPU Name: | Intel Xeon Platinum 8280 @ 2.70GHz (Intel Turbo Boost Technology up to 4.00 GHz) |
| CPU Characteristics: | 28-Core, 2.70 GHz, 38.5MB L3 Cache |
| CPU Frequency (MHz): | 2700 |
| CPU(s) Enabled: | 56 cores, 2 chips, 28 cores/chip |
| Hardware Threads: | 112 (2 / core) |
| CPU(s) Orderable: | 1,2 chips |
| Primary Cache: | 32 KB I + 32 KB D on chip per core |
| Secondary Cache: | 1 MB I+D on chip per core |
| Tertiary Cache: | 39424 KB I+D on chip per chip |
| Other Cache: | None |
| Memory Amount (GB): | 192 |
| # and size of DIMM: | 12 x 16384 MB |
| Memory Details: | 12 x 16GB 2Rx8 PC4-2933Y-R; slots 1, 3, 5, 8, 10 and 12 populated in each socket |
| Power Supply Quantity and Rating (W): | None |
| Power Supply Details: | N/A |
| Disk Drive: | 1 x HPE 240GB 6G SATA M.2 SSD (875488-B21) |
| Disk Controller: | HPE Smart Array S100i SR Gen10 |
| # and type of Network Interface Cards (NICs) Installed: | 1 x HPE Synergy 3820C 10/20Gb CNA |
| NICs Enabled in Firmware / OS / Connected: | 2/2/1 |
| Network Speed (Mbit): | 1000 |
| Keyboard: | None |
| Mouse: | None |
| Monitor: | None |
| Optical Drives: | No |
| Other Hardware: | H/S: Standard |
| Software | |
|---|---|
| Power Management: | Enabled (see SUT Notes) |
| Operating System (OS): | Windows Server 2012 R2 Datacenter |
| OS Version: | Version 6.3 (Build 9600) |
| Filesystem: | NTFS |
| JVM Vendor: | Oracle Corporation |
| JVM Version: | Oracle Java HotSpot(TM) 64-Bit Server VM (build 24.80-b11, mixed mode), version 1.7.0_80 |
| JVM Command-line Options: | -server -Xmn21000m -Xms24000m -Xmx24000m -XX:SurvivorRatio=1 -XX:TargetSurvivorRatio=99 -XX:AllocatePrefetchDistance=256 -XX:AllocatePrefetchLines=4 -XX:LoopUnrollLimit=45 -XX:InitialTenuringThreshold=12 -XX:MaxTenuringThreshold=15 -XX:ParallelGCThreads=28 -XX:InlineSmallCode=3900 -XX:MaxInlineSize=270 -XX:FreqInlineSize=2500 -XX:+AggressiveOpts -XX:+UseLargePages -XX:+UseParallelOldGC |
| JVM Affinity: | start /NODE [0,1,2,3] /AFFINITY [0xFFFFFFF] |
| JVM Instances: | 4 |
| JVM Initial Heap (MB): | 24000 |
| JVM Maximum Heap (MB): | 24000 |
| JVM Address Bits: | 64 |
| Boot Firmware Version: | I42 v2.00 (02/02/2019) |
| Management Firmware Version: | 1.40 Feb 05 2019 |
| Workload Version: | SSJ 1.2.10 |
| Director Location: | Controller |
| Other Software: | HPE Service Pack for ProLiant (SPP) Version: 2019.03.0, Microsoft Windows KB4056898, KB4338815 |
| JVM Instance | ssj_ops@100% |
|---|---|
| NODE02.001 | 1,426,401 |
| NODE02.002 | 1,422,391 |
| NODE02.003 | 1,441,291 |
| NODE02.004 | 1,431,112 |
| ssj_ops@100% | 5,721,194 |
| ssj_ops@100% per JVM | 1,430,299 |

| Target Load | Actual Load | ssj_ops | |
|---|---|---|---|
| Target | Actual | ||
| Calibration 1 | 1,433,720 | ||
| Calibration 2 | 1,430,529 | ||
| Calibration 3 | 1,432,376 | ||
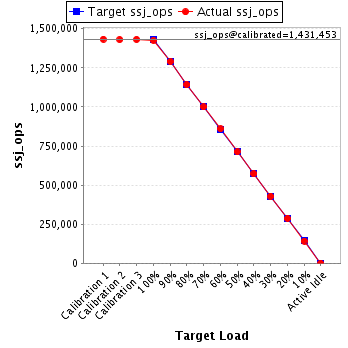
| ssj_ops@calibrated=1,431,453 | |||
| 100% | 99.6% | 1,431,453 | 1,426,401 |
| 90% | 90.2% | 1,288,307 | 1,290,844 |
| 80% | 79.8% | 1,145,162 | 1,142,813 |
| 70% | 69.9% | 1,002,017 | 999,978 |
| 60% | 60.1% | 858,872 | 859,840 |
| 50% | 49.8% | 715,726 | 712,592 |
| 40% | 40.0% | 572,581 | 571,926 |
| 30% | 30.0% | 429,436 | 429,888 |
| 20% | 20.0% | 286,291 | 286,864 |
| 10% | 9.9% | 143,145 | 142,393 |
| Active Idle | 0 | 0 | |
| Target Load | Actual Load | ssj_ops | |
|---|---|---|---|
| Target | Actual | ||
| Calibration 1 | 1,429,210 | ||
| Calibration 2 | 1,424,829 | ||
| Calibration 3 | 1,428,378 | ||
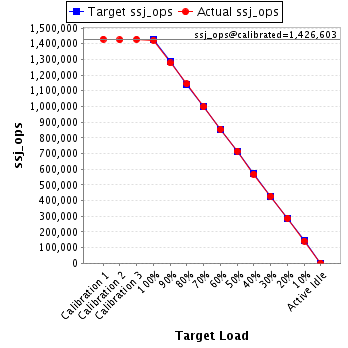
| ssj_ops@calibrated=1,426,603 | |||
| 100% | 99.7% | 1,426,603 | 1,422,391 |
| 90% | 89.5% | 1,283,943 | 1,277,518 |
| 80% | 80.2% | 1,141,283 | 1,144,424 |
| 70% | 70.0% | 998,622 | 998,526 |
| 60% | 59.9% | 855,962 | 854,920 |
| 50% | 50.2% | 713,302 | 715,497 |
| 40% | 39.8% | 570,641 | 568,294 |
| 30% | 30.0% | 427,981 | 428,037 |
| 20% | 20.1% | 285,321 | 287,098 |
| 10% | 9.9% | 142,660 | 141,681 |
| Active Idle | 0 | 0 | |
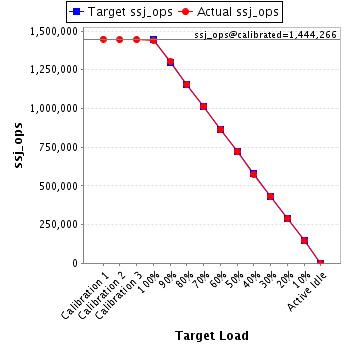
| Target Load | Actual Load | ssj_ops | |
|---|---|---|---|
| Target | Actual | ||
| Calibration 1 | 1,447,933 | ||
| Calibration 2 | 1,444,298 | ||
| Calibration 3 | 1,444,235 | ||
| ssj_ops@calibrated=1,444,266 | |||
| 100% | 99.8% | 1,444,266 | 1,441,291 |
| 90% | 90.3% | 1,299,840 | 1,303,780 |
| 80% | 80.0% | 1,155,413 | 1,155,632 |
| 70% | 70.1% | 1,010,987 | 1,012,860 |
| 60% | 59.9% | 866,560 | 865,734 |
| 50% | 50.0% | 722,133 | 721,884 |
| 40% | 39.9% | 577,707 | 576,362 |
| 30% | 30.0% | 433,280 | 433,496 |
| 20% | 19.9% | 288,853 | 287,335 |
| 10% | 10.0% | 144,427 | 144,927 |
| Active Idle | 0 | 0 | |
| Target Load | Actual Load | ssj_ops | |
|---|---|---|---|
| Target | Actual | ||
| Calibration 1 | 1,436,348 | ||
| Calibration 2 | 1,434,434 | ||
| Calibration 3 | 1,435,905 | ||
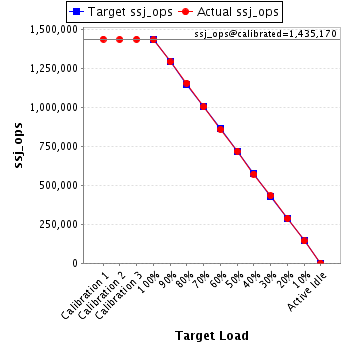
| ssj_ops@calibrated=1,435,170 | |||
| 100% | 99.7% | 1,435,170 | 1,431,112 |
| 90% | 89.9% | 1,291,653 | 1,290,693 |
| 80% | 80.5% | 1,148,136 | 1,154,997 |
| 70% | 69.8% | 1,004,619 | 1,002,015 |
| 60% | 59.8% | 861,102 | 858,551 |
| 50% | 50.0% | 717,585 | 717,808 |
| 40% | 39.9% | 574,068 | 571,934 |
| 30% | 30.1% | 430,551 | 431,757 |
| 20% | 20.1% | 287,034 | 288,064 |
| 10% | 10.0% | 143,517 | 142,898 |
| Active Idle | 0 | 0 | |