
SPECpower_ssj2008
Host 'NODE03' Performance Report
Copyright © 2007-2019 Standard Performance Evaluation Corporation
| Hewlett Packard Enterprise Synergy 480 Gen10 Compute Module | ssj_ops@100% = 5,772,513 ssj_ops@100% per JVM = 1,443,128 |
||||
| Test Sponsor: | Hewlett Packard Enterprise | SPEC License #: | 3 | Test Method: | Multi Node |
| Tested By: | Hewlett Packard Enterprise | Test Location: | Houston, TX, USA | Test Date: | Mar 27, 2019 |
| Hardware Availability: | Apr-2019 | Software Availability: | Mar-2019 | Publication: | May 8, 2019 |
| System Source: | Single Supplier | System Designation: | Server | Power Provisioning: | Line-powered |
| Target Load | Actual Load | ssj_ops | |
|---|---|---|---|
| Target | Actual | ||
| Calibration 1 | 5,796,164 | ||
| Calibration 2 | 5,788,192 | ||
| Calibration 3 | 5,789,648 | ||
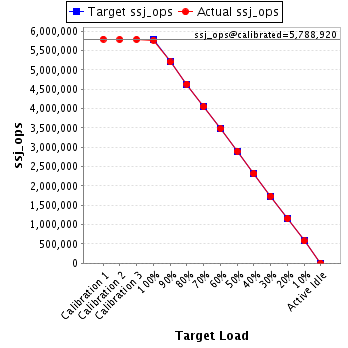
| ssj_ops@calibrated=5,788,920 | |||
| 100% | 99.7% | 5,788,920 | 5,772,513 |
| 90% | 89.9% | 5,210,028 | 5,205,946 |
| 80% | 80.1% | 4,631,136 | 4,634,186 |
| 70% | 70.0% | 4,052,244 | 4,054,191 |
| 60% | 60.1% | 3,473,352 | 3,477,914 |
| 50% | 50.0% | 2,894,460 | 2,896,998 |
| 40% | 40.0% | 2,315,568 | 2,316,135 |
| 30% | 30.0% | 1,736,676 | 1,738,219 |
| 20% | 20.0% | 1,157,784 | 1,156,250 |
| 10% | 10.0% | 578,892 | 576,612 |
| Active Idle | 0 | 0 | |
| Set Identifier: | SUT |
| Set Description: | System Under Test |
| # of Identical Nodes: | 5 |
| Comment: | SUT |
| Hardware | |
|---|---|
| Hardware Vendor: | Hewlett Packard Enterprise |
| Model: | Synergy 480 Gen10 Compute Module |
| Form Factor: | 7U |
| CPU Name: | Intel Xeon Platinum 8280 @ 2.70GHz (Intel Turbo Boost Technology up to 4.00 GHz) |
| CPU Characteristics: | 28-Core, 2.70 GHz, 38.5MB L3 Cache |
| CPU Frequency (MHz): | 2700 |
| CPU(s) Enabled: | 56 cores, 2 chips, 28 cores/chip |
| Hardware Threads: | 112 (2 / core) |
| CPU(s) Orderable: | 1,2 chips |
| Primary Cache: | 32 KB I + 32 KB D on chip per core |
| Secondary Cache: | 1 MB I+D on chip per core |
| Tertiary Cache: | 39424 KB I+D on chip per chip |
| Other Cache: | None |
| Memory Amount (GB): | 192 |
| # and size of DIMM: | 12 x 16384 MB |
| Memory Details: | 12 x 16GB 2Rx8 PC4-2933Y-R; slots 1, 3, 5, 8, 10 and 12 populated in each socket |
| Power Supply Quantity and Rating (W): | None |
| Power Supply Details: | N/A |
| Disk Drive: | 1 x HPE 240GB 6G SATA M.2 SSD (875488-B21) |
| Disk Controller: | HPE Smart Array S100i SR Gen10 |
| # and type of Network Interface Cards (NICs) Installed: | 1 x HPE Synergy 3820C 10/20Gb CNA |
| NICs Enabled in Firmware / OS / Connected: | 2/2/1 |
| Network Speed (Mbit): | 1000 |
| Keyboard: | None |
| Mouse: | None |
| Monitor: | None |
| Optical Drives: | No |
| Other Hardware: | H/S: Standard |
| Software | |
|---|---|
| Power Management: | Enabled (see SUT Notes) |
| Operating System (OS): | Windows Server 2012 R2 Datacenter |
| OS Version: | Version 6.3 (Build 9600) |
| Filesystem: | NTFS |
| JVM Vendor: | Oracle Corporation |
| JVM Version: | Oracle Java HotSpot(TM) 64-Bit Server VM (build 24.80-b11, mixed mode), version 1.7.0_80 |
| JVM Command-line Options: | -server -Xmn21000m -Xms24000m -Xmx24000m -XX:SurvivorRatio=1 -XX:TargetSurvivorRatio=99 -XX:AllocatePrefetchDistance=256 -XX:AllocatePrefetchLines=4 -XX:LoopUnrollLimit=45 -XX:InitialTenuringThreshold=12 -XX:MaxTenuringThreshold=15 -XX:ParallelGCThreads=28 -XX:InlineSmallCode=3900 -XX:MaxInlineSize=270 -XX:FreqInlineSize=2500 -XX:+AggressiveOpts -XX:+UseLargePages -XX:+UseParallelOldGC |
| JVM Affinity: | start /NODE [0,1,2,3] /AFFINITY [0xFFFFFFF] |
| JVM Instances: | 4 |
| JVM Initial Heap (MB): | 24000 |
| JVM Maximum Heap (MB): | 24000 |
| JVM Address Bits: | 64 |
| Boot Firmware Version: | I42 v2.00 (02/02/2019) |
| Management Firmware Version: | 1.40 Feb 05 2019 |
| Workload Version: | SSJ 1.2.10 |
| Director Location: | Controller |
| Other Software: | HPE Service Pack for ProLiant (SPP) Version: 2019.03.0, Microsoft Windows KB4056898, KB4338815 |
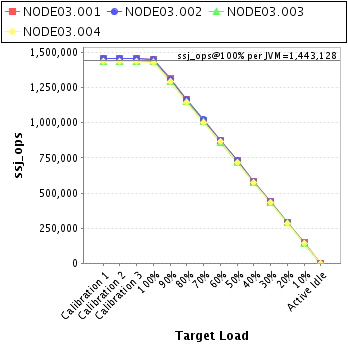
| JVM Instance | ssj_ops@100% |
|---|---|
| NODE03.001 | 1,453,110 |
| NODE03.002 | 1,453,866 |
| NODE03.003 | 1,433,893 |
| NODE03.004 | 1,431,644 |
| ssj_ops@100% | 5,772,513 |
| ssj_ops@100% per JVM | 1,443,128 |
| Target Load | Actual Load | ssj_ops | |
|---|---|---|---|
| Target | Actual | ||
| Calibration 1 | 1,456,706 | ||
| Calibration 2 | 1,456,011 | ||
| Calibration 3 | 1,458,954 | ||
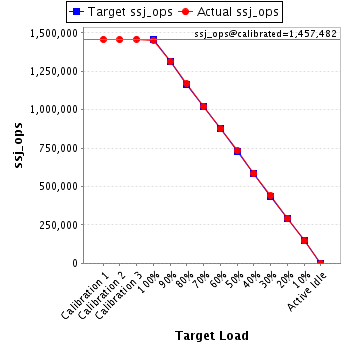
| ssj_ops@calibrated=1,457,482 | |||
| 100% | 99.7% | 1,457,482 | 1,453,110 |
| 90% | 90.0% | 1,311,734 | 1,311,984 |
| 80% | 80.2% | 1,165,986 | 1,169,449 |
| 70% | 69.9% | 1,020,238 | 1,018,911 |
| 60% | 60.0% | 874,489 | 874,871 |
| 50% | 50.2% | 728,741 | 731,627 |
| 40% | 40.2% | 582,993 | 585,343 |
| 30% | 30.1% | 437,245 | 438,320 |
| 20% | 20.0% | 291,496 | 291,156 |
| 10% | 10.0% | 145,748 | 145,158 |
| Active Idle | 0 | 0 | |
| Target Load | Actual Load | ssj_ops | |
|---|---|---|---|
| Target | Actual | ||
| Calibration 1 | 1,460,122 | ||
| Calibration 2 | 1,458,033 | ||
| Calibration 3 | 1,456,667 | ||
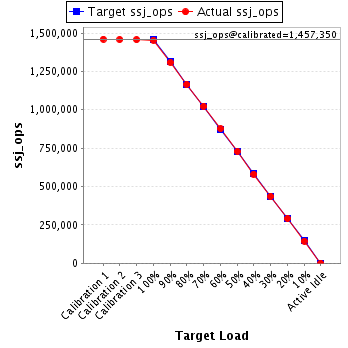
| ssj_ops@calibrated=1,457,350 | |||
| 100% | 99.8% | 1,457,350 | 1,453,866 |
| 90% | 89.8% | 1,311,615 | 1,308,477 |
| 80% | 80.0% | 1,165,880 | 1,165,582 |
| 70% | 70.3% | 1,020,145 | 1,024,222 |
| 60% | 60.2% | 874,410 | 876,854 |
| 50% | 50.0% | 728,675 | 728,830 |
| 40% | 39.8% | 582,940 | 580,611 |
| 30% | 30.0% | 437,205 | 436,582 |
| 20% | 20.0% | 291,470 | 290,963 |
| 10% | 9.9% | 145,735 | 144,206 |
| Active Idle | 0 | 0 | |
| Target Load | Actual Load | ssj_ops | |
|---|---|---|---|
| Target | Actual | ||
| Calibration 1 | 1,439,318 | ||
| Calibration 2 | 1,439,404 | ||
| Calibration 3 | 1,438,382 | ||
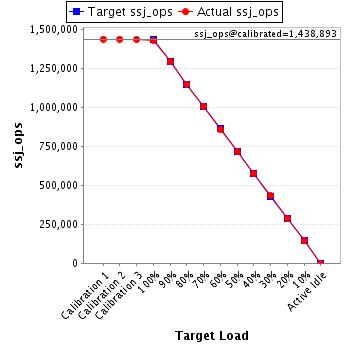
| ssj_ops@calibrated=1,438,893 | |||
| 100% | 99.7% | 1,438,893 | 1,433,893 |
| 90% | 89.9% | 1,295,004 | 1,293,780 |
| 80% | 80.0% | 1,151,114 | 1,151,099 |
| 70% | 70.0% | 1,007,225 | 1,007,287 |
| 60% | 59.8% | 863,336 | 860,039 |
| 50% | 50.0% | 719,447 | 719,006 |
| 40% | 40.0% | 575,557 | 575,437 |
| 30% | 30.1% | 431,668 | 432,474 |
| 20% | 20.1% | 287,779 | 288,590 |
| 10% | 10.0% | 143,889 | 143,354 |
| Active Idle | 0 | 0 | |
| Target Load | Actual Load | ssj_ops | |
|---|---|---|---|
| Target | Actual | ||
| Calibration 1 | 1,440,019 | ||
| Calibration 2 | 1,434,743 | ||
| Calibration 3 | 1,435,645 | ||
| ssj_ops@calibrated=1,435,194 | |||
| 100% | 99.8% | 1,435,194 | 1,431,644 |
| 90% | 90.0% | 1,291,675 | 1,291,705 |
| 80% | 80.0% | 1,148,155 | 1,148,056 |
| 70% | 69.9% | 1,004,636 | 1,003,771 |
| 60% | 60.4% | 861,116 | 866,150 |
| 50% | 50.0% | 717,597 | 717,535 |
| 40% | 40.0% | 574,078 | 574,744 |
| 30% | 30.0% | 430,558 | 430,843 |
| 20% | 19.9% | 287,039 | 285,542 |
| 10% | 10.0% | 143,519 | 143,894 |
| Active Idle | 0 | 0 | |
