SPECpower_ssj2008
Host 'NODE01' Performance Report
Copyright © 2007-2019 Standard Performance Evaluation Corporation
| Hewlett Packard Enterprise Synergy 480 Gen10 Compute Module | ssj_ops@100% = 5,790,203 ssj_ops@100% per JVM = 1,447,551 |
||||
| Test Sponsor: | Hewlett Packard Enterprise | SPEC License #: | 3 | Test Method: | Multi Node |
| Tested By: | Hewlett Packard Enterprise | Test Location: | Houston, TX, USA | Test Date: | Mar 27, 2019 |
| Hardware Availability: | Apr-2019 | Software Availability: | Mar-2019 | Publication: | May 8, 2019 |
| System Source: | Single Supplier | System Designation: | Server | Power Provisioning: | Line-powered |
| Target Load | Actual Load | ssj_ops | |
|---|---|---|---|
| Target | Actual | ||
| Calibration 1 | 5,812,567 | ||
| Calibration 2 | 5,803,902 | ||
| Calibration 3 | 5,810,742 | ||
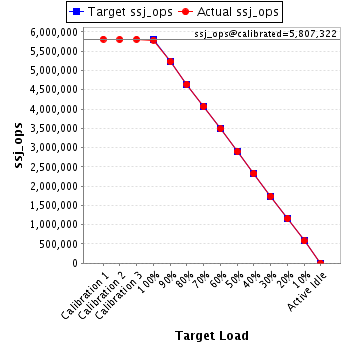
| ssj_ops@calibrated=5,807,322 | |||
| 100% | 99.7% | 5,807,322 | 5,790,203 |
| 90% | 90.1% | 5,226,590 | 5,231,064 |
| 80% | 79.9% | 4,645,858 | 4,638,827 |
| 70% | 70.0% | 4,065,126 | 4,067,734 |
| 60% | 60.0% | 3,484,393 | 3,485,037 |
| 50% | 49.9% | 2,903,661 | 2,897,435 |
| 40% | 40.0% | 2,322,929 | 2,325,725 |
| 30% | 30.0% | 1,742,197 | 1,742,619 |
| 20% | 20.0% | 1,161,464 | 1,159,804 |
| 10% | 10.0% | 580,732 | 578,663 |
| Active Idle | 0 | 0 | |
| Set Identifier: | SUT |
| Set Description: | System Under Test |
| # of Identical Nodes: | 4 |
| Comment: | SUT |
| Hardware | |
|---|---|
| Hardware Vendor: | Hewlett Packard Enterprise |
| Model: | Synergy 480 Gen10 Compute Module |
| Form Factor: | 7U |
| CPU Name: | Intel Xeon Platinum 8280 @ 2.70GHz (Intel Turbo Boost Technology up to 4.00 GHz) |
| CPU Characteristics: | 28-Core, 2.70 GHz, 38.5MB L3 Cache |
| CPU Frequency (MHz): | 2700 |
| CPU(s) Enabled: | 56 cores, 2 chips, 28 cores/chip |
| Hardware Threads: | 112 (2 / core) |
| CPU(s) Orderable: | 1,2 chips |
| Primary Cache: | 32 KB I + 32 KB D on chip per core |
| Secondary Cache: | 1 MB I+D on chip per core |
| Tertiary Cache: | 39424 KB I+D on chip per chip |
| Other Cache: | None |
| Memory Amount (GB): | 192 |
| # and size of DIMM: | 12 x 16384 MB |
| Memory Details: | 12 x 16GB 2Rx8 PC4-2933Y-R; slots 1, 3, 5, 8, 10 and 12 populated in each socket |
| Power Supply Quantity and Rating (W): | None |
| Power Supply Details: | N/A |
| Disk Drive: | 1 x HPE 240GB 6G SATA M.2 SSD (875488-B21) |
| Disk Controller: | HPE Smart Array S100i SR Gen10 |
| # and type of Network Interface Cards (NICs) Installed: | 1 x HPE Synergy 3820C 10/20Gb CNA |
| NICs Enabled in Firmware / OS / Connected: | 2/2/1 |
| Network Speed (Mbit): | 1000 |
| Keyboard: | None |
| Mouse: | None |
| Monitor: | None |
| Optical Drives: | No |
| Other Hardware: | H/S: Standard |
| Software | |
|---|---|
| Power Management: | Enabled (see SUT Notes) |
| Operating System (OS): | Windows Server 2012 R2 Datacenter |
| OS Version: | Version 6.3 (Build 9600) |
| Filesystem: | NTFS |
| JVM Vendor: | Oracle Corporation |
| JVM Version: | Oracle Java HotSpot(TM) 64-Bit Server VM (build 24.80-b11, mixed mode), version 1.7.0_80 |
| JVM Command-line Options: | -server -Xmn21000m -Xms24000m -Xmx24000m -XX:SurvivorRatio=1 -XX:TargetSurvivorRatio=99 -XX:AllocatePrefetchDistance=256 -XX:AllocatePrefetchLines=4 -XX:LoopUnrollLimit=45 -XX:InitialTenuringThreshold=12 -XX:MaxTenuringThreshold=15 -XX:ParallelGCThreads=28 -XX:InlineSmallCode=3900 -XX:MaxInlineSize=270 -XX:FreqInlineSize=2500 -XX:+AggressiveOpts -XX:+UseLargePages -XX:+UseParallelOldGC |
| JVM Affinity: | start /NODE [0,1,2,3] /AFFINITY [0xFFFFFFF] |
| JVM Instances: | 4 |
| JVM Initial Heap (MB): | 24000 |
| JVM Maximum Heap (MB): | 24000 |
| JVM Address Bits: | 64 |
| Boot Firmware Version: | I42 v2.00 (02/02/2019) |
| Management Firmware Version: | 1.40 Feb 05 2019 |
| Workload Version: | SSJ 1.2.10 |
| Director Location: | Controller |
| Other Software: | HPE Service Pack for ProLiant (SPP) Version: 2019.03.0, Microsoft Windows KB4056898, KB4338815 |
| JVM Instance | ssj_ops@100% |
|---|---|
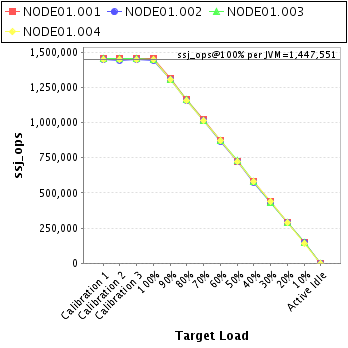
| NODE01.001 | 1,453,071 |
| NODE01.002 | 1,443,746 |
| NODE01.003 | 1,446,819 |
| NODE01.004 | 1,446,567 |
| ssj_ops@100% | 5,790,203 |
| ssj_ops@100% per JVM | 1,447,551 |
| Target Load | Actual Load | ssj_ops | |
|---|---|---|---|
| Target | Actual | ||
| Calibration 1 | 1,458,563 | ||
| Calibration 2 | 1,455,793 | ||
| Calibration 3 | 1,457,577 | ||
| ssj_ops@calibrated=1,456,685 | |||
| 100% | 99.8% | 1,456,685 | 1,453,071 |
| 90% | 90.0% | 1,311,016 | 1,310,689 |
| 80% | 79.8% | 1,165,348 | 1,163,074 |
| 70% | 70.1% | 1,019,679 | 1,020,941 |
| 60% | 60.1% | 874,011 | 874,819 |
| 50% | 49.9% | 728,342 | 726,455 |
| 40% | 40.1% | 582,674 | 584,594 |
| 30% | 30.0% | 437,005 | 436,795 |
| 20% | 20.0% | 291,337 | 291,134 |
| 10% | 10.0% | 145,668 | 144,978 |
| Active Idle | 0 | 0 | |

| Target Load | Actual Load | ssj_ops | |
|---|---|---|---|
| Target | Actual | ||
| Calibration 1 | 1,446,698 | ||
| Calibration 2 | 1,445,020 | ||
| Calibration 3 | 1,448,497 | ||
| ssj_ops@calibrated=1,446,759 | |||
| 100% | 99.8% | 1,446,759 | 1,443,746 |
| 90% | 90.3% | 1,302,083 | 1,306,350 |
| 80% | 79.9% | 1,157,407 | 1,155,496 |
| 70% | 70.1% | 1,012,731 | 1,014,212 |
| 60% | 59.9% | 868,055 | 866,321 |
| 50% | 49.9% | 723,379 | 721,356 |
| 40% | 39.9% | 578,703 | 577,642 |
| 30% | 29.9% | 434,028 | 432,165 |
| 20% | 20.0% | 289,352 | 289,884 |
| 10% | 10.1% | 144,676 | 145,597 |
| Active Idle | 0 | 0 | |

| Target Load | Actual Load | ssj_ops | |
|---|---|---|---|
| Target | Actual | ||
| Calibration 1 | 1,455,206 | ||
| Calibration 2 | 1,453,462 | ||
| Calibration 3 | 1,454,904 | ||
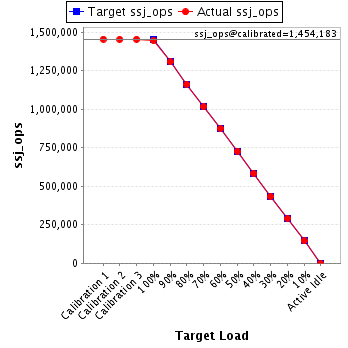
| ssj_ops@calibrated=1,454,183 | |||
| 100% | 99.5% | 1,454,183 | 1,446,819 |
| 90% | 89.9% | 1,308,765 | 1,307,493 |
| 80% | 79.9% | 1,163,347 | 1,162,140 |
| 70% | 69.9% | 1,017,928 | 1,016,409 |
| 60% | 60.1% | 872,510 | 873,938 |
| 50% | 50.0% | 727,092 | 727,337 |
| 40% | 40.0% | 581,673 | 581,866 |
| 30% | 29.9% | 436,255 | 434,220 |
| 20% | 20.0% | 290,837 | 290,923 |
| 10% | 10.0% | 145,418 | 145,235 |
| Active Idle | 0 | 0 | |
| Target Load | Actual Load | ssj_ops | |
|---|---|---|---|
| Target | Actual | ||
| Calibration 1 | 1,452,101 | ||
| Calibration 2 | 1,449,627 | ||
| Calibration 3 | 1,449,764 | ||
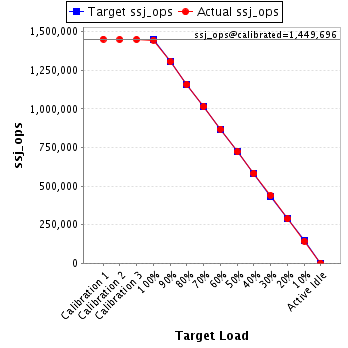
| ssj_ops@calibrated=1,449,696 | |||
| 100% | 99.8% | 1,449,696 | 1,446,567 |
| 90% | 90.1% | 1,304,726 | 1,306,532 |
| 80% | 79.9% | 1,159,757 | 1,158,117 |
| 70% | 70.1% | 1,014,787 | 1,016,171 |
| 60% | 60.0% | 869,817 | 869,959 |
| 50% | 49.8% | 724,848 | 722,287 |
| 40% | 40.1% | 579,878 | 581,623 |
| 30% | 30.3% | 434,909 | 439,438 |
| 20% | 19.9% | 289,939 | 287,862 |
| 10% | 9.9% | 144,970 | 142,853 |
| Active Idle | 0 | 0 | |