SPECpower_ssj2008
Host 'NODE01' Performance Report
Copyright © 2007-2019 Standard Performance Evaluation Corporation
| Hewlett Packard Enterprise Synergy 480 Gen10 Compute Module | ssj_ops@100% = 5,736,944 ssj_ops@100% per JVM = 1,434,236 |
||||
| Test Sponsor: | Hewlett Packard Enterprise | SPEC License #: | 3 | Test Method: | Multi Node |
| Tested By: | Hewlett Packard Enterprise | Test Location: | Houston, TX, USA | Test Date: | Mar 28, 2019 |
| Hardware Availability: | Apr-2019 | Software Availability: | Mar-2019 | Publication: | May 8, 2019 |
| System Source: | Single Supplier | System Designation: | Server | Power Provisioning: | Line-powered |
| Target Load | Actual Load | ssj_ops | |
|---|---|---|---|
| Target | Actual | ||
| Calibration 1 | 5,758,940 | ||
| Calibration 2 | 5,755,860 | ||
| Calibration 3 | 5,756,513 | ||
| ssj_ops@calibrated=5,756,186 | |||
| 100% | 99.7% | 5,756,186 | 5,736,944 |
| 90% | 90.1% | 5,180,568 | 5,186,639 |
| 80% | 79.9% | 4,604,949 | 4,601,058 |
| 70% | 69.9% | 4,029,330 | 4,023,725 |
| 60% | 60.0% | 3,453,712 | 3,451,224 |
| 50% | 50.0% | 2,878,093 | 2,879,971 |
| 40% | 39.9% | 2,302,475 | 2,299,462 |
| 30% | 30.1% | 1,726,856 | 1,732,339 |
| 20% | 20.0% | 1,151,237 | 1,151,470 |
| 10% | 10.0% | 575,619 | 576,950 |
| Active Idle | 0 | 0 | |

| Set Identifier: | SUT |
| Set Description: | System Under Test |
| # of Identical Nodes: | 3 |
| Comment: | SUT |
| Hardware | |
|---|---|
| Hardware Vendor: | Hewlett Packard Enterprise |
| Model: | Synergy 480 Gen10 Compute Module |
| Form Factor: | 7U |
| CPU Name: | Intel Xeon Platinum 8280 @ 2.70GHz (Intel Turbo Boost Technology up to 4.00 GHz) |
| CPU Characteristics: | 28-Core, 2.70 GHz, 38.5MB L3 Cache |
| CPU Frequency (MHz): | 2700 |
| CPU(s) Enabled: | 56 cores, 2 chips, 28 cores/chip |
| Hardware Threads: | 112 (2 / core) |
| CPU(s) Orderable: | 1,2 chips |
| Primary Cache: | 32 KB I + 32 KB D on chip per core |
| Secondary Cache: | 1 MB I+D on chip per core |
| Tertiary Cache: | 39424 KB I+D on chip per chip |
| Other Cache: | None |
| Memory Amount (GB): | 192 |
| # and size of DIMM: | 12 x 16384 MB |
| Memory Details: | 12 x 16GB 2Rx8 PC4-2933Y-R; slots 1, 3, 5, 8, 10 and 12 populated in each socket |
| Power Supply Quantity and Rating (W): | None |
| Power Supply Details: | N/A |
| Disk Drive: | 1 x HPE 240GB 6G SATA M.2 SSD (875488-B21) |
| Disk Controller: | HPE Smart Array S100i SR Gen10 |
| # and type of Network Interface Cards (NICs) Installed: | 1 x HPE Synergy 3820C 10/20Gb CNA |
| NICs Enabled in Firmware / OS / Connected: | 2/2/1 |
| Network Speed (Mbit): | 1000 |
| Keyboard: | None |
| Mouse: | None |
| Monitor: | None |
| Optical Drives: | No |
| Other Hardware: | H/S: Standard |
| Software | |
|---|---|
| Power Management: | Enabled (see SUT Notes) |
| Operating System (OS): | Windows Server 2012 R2 Datacenter |
| OS Version: | Version 6.3 (Build 9600) |
| Filesystem: | NTFS |
| JVM Vendor: | Oracle Corporation |
| JVM Version: | Oracle Java HotSpot(TM) 64-Bit Server VM (build 24.80-b11, mixed mode), version 1.7.0_80 |
| JVM Command-line Options: | -server -Xmn21000m -Xms24000m -Xmx24000m -XX:SurvivorRatio=1 -XX:TargetSurvivorRatio=99 -XX:AllocatePrefetchDistance=256 -XX:AllocatePrefetchLines=4 -XX:LoopUnrollLimit=45 -XX:InitialTenuringThreshold=12 -XX:MaxTenuringThreshold=15 -XX:ParallelGCThreads=28 -XX:InlineSmallCode=3900 -XX:MaxInlineSize=270 -XX:FreqInlineSize=2500 -XX:+AggressiveOpts -XX:+UseLargePages -XX:+UseParallelOldGC |
| JVM Affinity: | start /NODE [0,1,2,3] /AFFINITY [0xFFFFFFF] |
| JVM Instances: | 4 |
| JVM Initial Heap (MB): | 24000 |
| JVM Maximum Heap (MB): | 24000 |
| JVM Address Bits: | 64 |
| Boot Firmware Version: | I42 v2.00 (02/02/2019) |
| Management Firmware Version: | 1.40 Feb 05 2019 |
| Workload Version: | SSJ 1.2.10 |
| Director Location: | Controller |
| Other Software: | HPE Service Pack for ProLiant (SPP) Version: 2019.03.0, Microsoft Windows KB4056898, KB4338815 |
| JVM Instance | ssj_ops@100% |
|---|---|
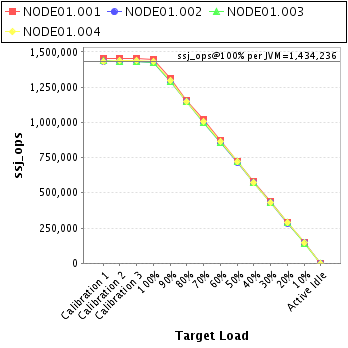
| NODE01.001 | 1,448,581 |
| NODE01.002 | 1,427,588 |
| NODE01.003 | 1,427,073 |
| NODE01.004 | 1,433,701 |
| ssj_ops@100% | 5,736,944 |
| ssj_ops@100% per JVM | 1,434,236 |
| Target Load | Actual Load | ssj_ops | |
|---|---|---|---|
| Target | Actual | ||
| Calibration 1 | 1,455,585 | ||
| Calibration 2 | 1,452,215 | ||
| Calibration 3 | 1,453,446 | ||
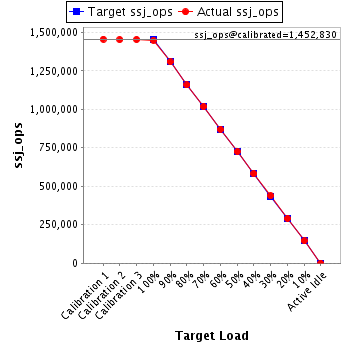
| ssj_ops@calibrated=1,452,830 | |||
| 100% | 99.7% | 1,452,830 | 1,448,581 |
| 90% | 90.0% | 1,307,547 | 1,308,239 |
| 80% | 79.7% | 1,162,264 | 1,157,963 |
| 70% | 70.1% | 1,016,981 | 1,017,840 |
| 60% | 59.9% | 871,698 | 870,827 |
| 50% | 49.9% | 726,415 | 724,837 |
| 40% | 40.0% | 581,132 | 581,339 |
| 30% | 30.1% | 435,849 | 437,657 |
| 20% | 20.0% | 290,566 | 291,140 |
| 10% | 10.0% | 145,283 | 145,628 |
| Active Idle | 0 | 0 | |
| Target Load | Actual Load | ssj_ops | |
|---|---|---|---|
| Target | Actual | ||
| Calibration 1 | 1,433,336 | ||
| Calibration 2 | 1,433,735 | ||
| Calibration 3 | 1,432,847 | ||
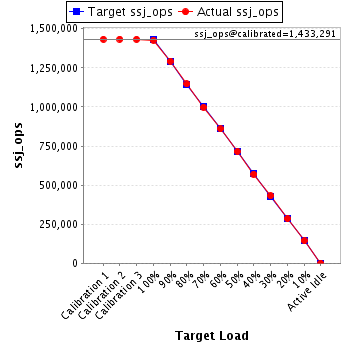
| ssj_ops@calibrated=1,433,291 | |||
| 100% | 99.6% | 1,433,291 | 1,427,588 |
| 90% | 90.2% | 1,289,962 | 1,292,917 |
| 80% | 80.0% | 1,146,633 | 1,147,167 |
| 70% | 69.7% | 1,003,304 | 999,155 |
| 60% | 60.0% | 859,974 | 859,350 |
| 50% | 49.9% | 716,645 | 715,047 |
| 40% | 39.8% | 573,316 | 570,503 |
| 30% | 30.1% | 429,987 | 431,216 |
| 20% | 19.9% | 286,658 | 284,799 |
| 10% | 10.1% | 143,329 | 144,227 |
| Active Idle | 0 | 0 | |
| Target Load | Actual Load | ssj_ops | |
|---|---|---|---|
| Target | Actual | ||
| Calibration 1 | 1,435,683 | ||
| Calibration 2 | 1,433,358 | ||
| Calibration 3 | 1,433,677 | ||
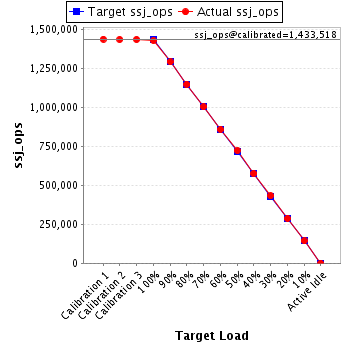
| ssj_ops@calibrated=1,433,518 | |||
| 100% | 99.6% | 1,433,518 | 1,427,073 |
| 90% | 90.0% | 1,290,166 | 1,290,172 |
| 80% | 80.0% | 1,146,814 | 1,146,841 |
| 70% | 69.9% | 1,003,462 | 1,001,947 |
| 60% | 59.9% | 860,111 | 858,845 |
| 50% | 50.3% | 716,759 | 721,235 |
| 40% | 40.1% | 573,407 | 574,557 |
| 30% | 30.1% | 430,055 | 431,601 |
| 20% | 20.0% | 286,704 | 287,144 |
| 10% | 10.0% | 143,352 | 143,116 |
| Active Idle | 0 | 0 | |
| Target Load | Actual Load | ssj_ops | |
|---|---|---|---|
| Target | Actual | ||
| Calibration 1 | 1,434,336 | ||
| Calibration 2 | 1,436,552 | ||
| Calibration 3 | 1,436,544 | ||
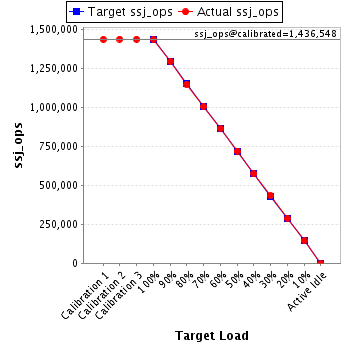
| ssj_ops@calibrated=1,436,548 | |||
| 100% | 99.8% | 1,436,548 | 1,433,701 |
| 90% | 90.2% | 1,292,893 | 1,295,310 |
| 80% | 80.0% | 1,149,238 | 1,149,088 |
| 70% | 69.9% | 1,005,584 | 1,004,784 |
| 60% | 60.0% | 861,929 | 862,203 |
| 50% | 50.0% | 718,274 | 718,852 |
| 40% | 39.9% | 574,619 | 573,062 |
| 30% | 30.1% | 430,964 | 431,866 |
| 20% | 20.1% | 287,310 | 288,386 |
| 10% | 10.0% | 143,655 | 143,980 |
| Active Idle | 0 | 0 | |