SPECpower_ssj2008
Host 'NODE02' Performance Report
Copyright © 2007-2019 Standard Performance Evaluation Corporation
| Hewlett Packard Enterprise Synergy 480 Gen10 Compute Module | ssj_ops@100% = 5,796,123 ssj_ops@100% per JVM = 1,449,031 |
||||
| Test Sponsor: | Hewlett Packard Enterprise | SPEC License #: | 3 | Test Method: | Multi Node |
| Tested By: | Hewlett Packard Enterprise | Test Location: | Houston, TX, USA | Test Date: | Mar 28, 2019 |
| Hardware Availability: | Apr-2019 | Software Availability: | Mar-2019 | Publication: | May 8, 2019 |
| System Source: | Single Supplier | System Designation: | Server | Power Provisioning: | Line-powered |
| Target Load | Actual Load | ssj_ops | |
|---|---|---|---|
| Target | Actual | ||
| Calibration 1 | 5,813,670 | ||
| Calibration 2 | 5,805,181 | ||
| Calibration 3 | 5,813,247 | ||
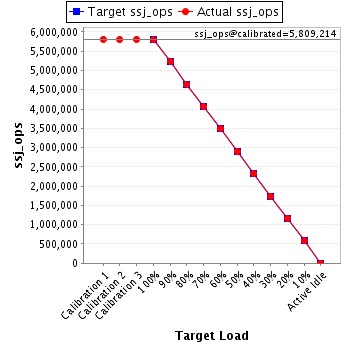
| ssj_ops@calibrated=5,809,214 | |||
| 100% | 99.8% | 5,809,214 | 5,796,123 |
| 90% | 90.1% | 5,228,293 | 5,235,961 |
| 80% | 79.9% | 4,647,371 | 4,640,890 |
| 70% | 69.9% | 4,066,450 | 4,061,963 |
| 60% | 60.1% | 3,485,528 | 3,492,288 |
| 50% | 50.0% | 2,904,607 | 2,903,933 |
| 40% | 39.9% | 2,323,686 | 2,319,703 |
| 30% | 30.0% | 1,742,764 | 1,743,983 |
| 20% | 20.0% | 1,161,843 | 1,164,259 |
| 10% | 10.0% | 580,921 | 579,845 |
| Active Idle | 0 | 0 | |
| Set Identifier: | SUT |
| Set Description: | System Under Test |
| # of Identical Nodes: | 2 |
| Comment: | SUT |
| Hardware | |
|---|---|
| Hardware Vendor: | Hewlett Packard Enterprise |
| Model: | Synergy 480 Gen10 Compute Module |
| Form Factor: | 7U |
| CPU Name: | Intel Xeon Platinum 8280 @ 2.70GHz (Intel Turbo Boost Technology up to 4.00 GHz) |
| CPU Characteristics: | 28-Core, 2.70 GHz, 38.5MB L3 Cache |
| CPU Frequency (MHz): | 2700 |
| CPU(s) Enabled: | 56 cores, 2 chips, 28 cores/chip |
| Hardware Threads: | 112 (2 / core) |
| CPU(s) Orderable: | 1,2 chips |
| Primary Cache: | 32 KB I + 32 KB D on chip per core |
| Secondary Cache: | 1 MB I+D on chip per core |
| Tertiary Cache: | 39424 KB I+D on chip per chip |
| Other Cache: | None |
| Memory Amount (GB): | 192 |
| # and size of DIMM: | 12 x 16384 MB |
| Memory Details: | 12 x 16GB 2Rx8 PC4-2933Y-R; slots 1, 3, 5, 8, 10 and 12 populated in each socket |
| Power Supply Quantity and Rating (W): | None |
| Power Supply Details: | N/A |
| Disk Drive: | 1 x HPE 240GB 6G SATA M.2 SSD (875488-B21) |
| Disk Controller: | HPE Smart Array S100i SR Gen10 |
| # and type of Network Interface Cards (NICs) Installed: | 1 x HPE Synergy 3820C 10/20Gb CNA |
| NICs Enabled in Firmware / OS / Connected: | 2/2/1 |
| Network Speed (Mbit): | 1000 |
| Keyboard: | None |
| Mouse: | None |
| Monitor: | None |
| Optical Drives: | No |
| Other Hardware: | H/S: Standard |
| Software | |
|---|---|
| Power Management: | Enabled (see SUT Notes) |
| Operating System (OS): | Windows Server 2012 R2 Datacenter |
| OS Version: | Version 6.3 (Build 9600) |
| Filesystem: | NTFS |
| JVM Vendor: | Oracle Corporation |
| JVM Version: | Oracle Java HotSpot(TM) 64-Bit Server VM (build 24.80-b11, mixed mode), version 1.7.0_80 |
| JVM Command-line Options: | -server -Xmn21000m -Xms24000m -Xmx24000m -XX:SurvivorRatio=1 -XX:TargetSurvivorRatio=99 -XX:AllocatePrefetchDistance=256 -XX:AllocatePrefetchLines=4 -XX:LoopUnrollLimit=45 -XX:InitialTenuringThreshold=12 -XX:MaxTenuringThreshold=15 -XX:ParallelGCThreads=28 -XX:InlineSmallCode=3900 -XX:MaxInlineSize=270 -XX:FreqInlineSize=2500 -XX:+AggressiveOpts -XX:+UseLargePages -XX:+UseParallelOldGC |
| JVM Affinity: | start /NODE [0,1,2,3] /AFFINITY [0xFFFFFFF] |
| JVM Instances: | 4 |
| JVM Initial Heap (MB): | 24000 |
| JVM Maximum Heap (MB): | 24000 |
| JVM Address Bits: | 64 |
| Boot Firmware Version: | I42 v2.00 (02/02/2019) |
| Management Firmware Version: | 1.40 Feb 05 2019 |
| Workload Version: | SSJ 1.2.10 |
| Director Location: | Controller |
| Other Software: | HPE Service Pack for ProLiant (SPP) Version: 2019.03.0, Microsoft Windows KB4056898, KB4338815 |
| JVM Instance | ssj_ops@100% |
|---|---|
| NODE02.001 | 1,444,881 |
| NODE02.002 | 1,452,760 |
| NODE02.003 | 1,447,022 |
| NODE02.004 | 1,451,461 |
| ssj_ops@100% | 5,796,123 |
| ssj_ops@100% per JVM | 1,449,031 |

| Target Load | Actual Load | ssj_ops | |
|---|---|---|---|
| Target | Actual | ||
| Calibration 1 | 1,448,438 | ||
| Calibration 2 | 1,446,850 | ||
| Calibration 3 | 1,449,267 | ||
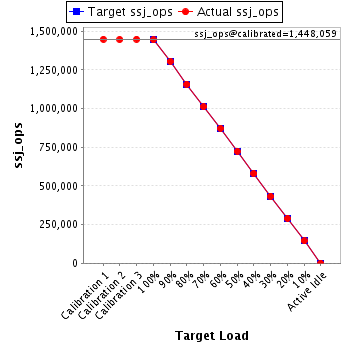
| ssj_ops@calibrated=1,448,059 | |||
| 100% | 99.8% | 1,448,059 | 1,444,881 |
| 90% | 90.1% | 1,303,253 | 1,305,336 |
| 80% | 79.9% | 1,158,447 | 1,157,550 |
| 70% | 69.9% | 1,013,641 | 1,012,261 |
| 60% | 60.3% | 868,835 | 873,019 |
| 50% | 50.0% | 724,029 | 724,579 |
| 40% | 40.0% | 579,224 | 579,827 |
| 30% | 30.0% | 434,418 | 434,348 |
| 20% | 20.0% | 289,612 | 290,319 |
| 10% | 10.0% | 144,806 | 144,513 |
| Active Idle | 0 | 0 | |
| Target Load | Actual Load | ssj_ops | |
|---|---|---|---|
| Target | Actual | ||
| Calibration 1 | 1,456,135 | ||
| Calibration 2 | 1,455,233 | ||
| Calibration 3 | 1,455,762 | ||
| ssj_ops@calibrated=1,455,497 | |||
| 100% | 99.8% | 1,455,497 | 1,452,760 |
| 90% | 90.2% | 1,309,948 | 1,312,237 |
| 80% | 79.7% | 1,164,398 | 1,159,430 |
| 70% | 70.0% | 1,018,848 | 1,019,573 |
| 60% | 60.2% | 873,298 | 875,559 |
| 50% | 49.8% | 727,749 | 725,164 |
| 40% | 39.8% | 582,199 | 579,761 |
| 30% | 30.1% | 436,649 | 437,944 |
| 20% | 20.0% | 291,099 | 291,451 |
| 10% | 10.0% | 145,550 | 145,035 |
| Active Idle | 0 | 0 | |

| Target Load | Actual Load | ssj_ops | |
|---|---|---|---|
| Target | Actual | ||
| Calibration 1 | 1,454,112 | ||
| Calibration 2 | 1,449,071 | ||
| Calibration 3 | 1,449,990 | ||
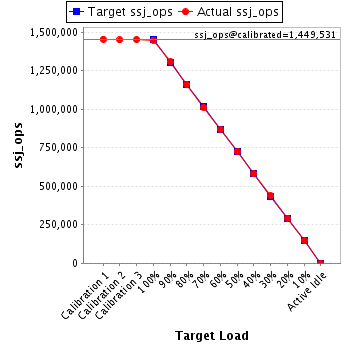
| ssj_ops@calibrated=1,449,531 | |||
| 100% | 99.8% | 1,449,531 | 1,447,022 |
| 90% | 90.1% | 1,304,577 | 1,306,146 |
| 80% | 80.1% | 1,159,624 | 1,161,500 |
| 70% | 69.8% | 1,014,671 | 1,012,359 |
| 60% | 60.0% | 869,718 | 869,631 |
| 50% | 50.0% | 724,765 | 725,302 |
| 40% | 40.0% | 579,812 | 579,384 |
| 30% | 30.2% | 434,859 | 437,432 |
| 20% | 20.0% | 289,906 | 290,341 |
| 10% | 10.1% | 144,953 | 145,804 |
| Active Idle | 0 | 0 | |
| Target Load | Actual Load | ssj_ops | |
|---|---|---|---|
| Target | Actual | ||
| Calibration 1 | 1,454,985 | ||
| Calibration 2 | 1,454,026 | ||
| Calibration 3 | 1,458,228 | ||
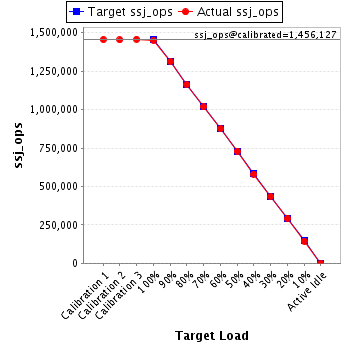
| ssj_ops@calibrated=1,456,127 | |||
| 100% | 99.7% | 1,456,127 | 1,451,461 |
| 90% | 90.1% | 1,310,515 | 1,312,242 |
| 80% | 79.8% | 1,164,902 | 1,162,409 |
| 70% | 69.9% | 1,019,289 | 1,017,771 |
| 60% | 60.0% | 873,676 | 874,079 |
| 50% | 50.1% | 728,064 | 728,887 |
| 40% | 39.9% | 582,451 | 580,731 |
| 30% | 29.8% | 436,838 | 434,259 |
| 20% | 20.1% | 291,225 | 292,147 |
| 10% | 9.9% | 145,613 | 144,492 |
| Active Idle | 0 | 0 | |