SPECpower_ssj2008
Host 'NODE01' Performance Report
Copyright © 2007-2019 Standard Performance Evaluation Corporation
| Hewlett Packard Enterprise Synergy 480 Gen10 Compute Module | ssj_ops@100% = 5,799,368 ssj_ops@100% per JVM = 1,449,842 |
||||
| Test Sponsor: | Hewlett Packard Enterprise | SPEC License #: | 3 | Test Method: | Multi Node |
| Tested By: | Hewlett Packard Enterprise | Test Location: | Houston, TX, USA | Test Date: | Mar 26, 2019 |
| Hardware Availability: | Apr-2019 | Software Availability: | Mar-2019 | Publication: | May 8, 2019 |
| System Source: | Single Supplier | System Designation: | Server | Power Provisioning: | Line-powered |
| Target Load | Actual Load | ssj_ops | |
|---|---|---|---|
| Target | Actual | ||
| Calibration 1 | 5,823,785 | ||
| Calibration 2 | 5,815,313 | ||
| Calibration 3 | 5,822,093 | ||
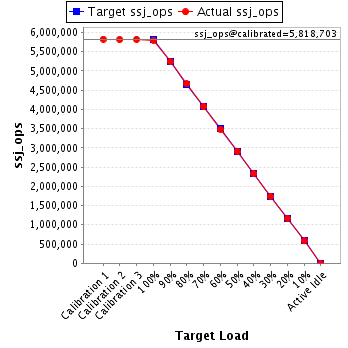
| ssj_ops@calibrated=5,818,703 | |||
| 100% | 99.7% | 5,818,703 | 5,799,368 |
| 90% | 90.0% | 5,236,832 | 5,237,418 |
| 80% | 80.1% | 4,654,962 | 4,661,934 |
| 70% | 70.0% | 4,073,092 | 4,074,771 |
| 60% | 59.9% | 3,491,222 | 3,484,352 |
| 50% | 50.0% | 2,909,351 | 2,907,590 |
| 40% | 40.0% | 2,327,481 | 2,327,825 |
| 30% | 30.0% | 1,745,611 | 1,743,234 |
| 20% | 20.0% | 1,163,741 | 1,164,890 |
| 10% | 10.0% | 581,870 | 581,017 |
| Active Idle | 0 | 0 | |
| Set Identifier: | SUT |
| Set Description: | System Under Test |
| # of Identical Nodes: | 11 |
| Comment: | SUT |
| Hardware | |
|---|---|
| Hardware Vendor: | Hewlett Packard Enterprise |
| Model: | Synergy 480 Gen10 Compute Module |
| Form Factor: | 7U |
| CPU Name: | Intel Xeon Platinum 8280 @ 2.70GHz (Intel Turbo Boost Technology up to 4.00 GHz) |
| CPU Characteristics: | 28-Core, 2.70 GHz, 38.5MB L3 Cache |
| CPU Frequency (MHz): | 2700 |
| CPU(s) Enabled: | 56 cores, 2 chips, 28 cores/chip |
| Hardware Threads: | 112 (2 / core) |
| CPU(s) Orderable: | 1,2 chips |
| Primary Cache: | 32 KB I + 32 KB D on chip per core |
| Secondary Cache: | 1 MB I+D on chip per core |
| Tertiary Cache: | 39424 KB I+D on chip per chip |
| Other Cache: | None |
| Memory Amount (GB): | 192 |
| # and size of DIMM: | 12 x 16384 MB |
| Memory Details: | 12 x 16GB 2Rx8 PC4-2933Y-R; slots 1, 3, 5, 8, 10 and 12 populated in each socket |
| Power Supply Quantity and Rating (W): | None |
| Power Supply Details: | N/A |
| Disk Drive: | 1 x HPE 240GB 6G SATA M.2 SSD (875488-B21) |
| Disk Controller: | HPE Smart Array S100i SR Gen10 |
| # and type of Network Interface Cards (NICs) Installed: | 1 x HPE Synergy 3820C 10/20Gb CNA |
| NICs Enabled in Firmware / OS / Connected: | 2/2/1 |
| Network Speed (Mbit): | 1000 |
| Keyboard: | None |
| Mouse: | None |
| Monitor: | None |
| Optical Drives: | No |
| Other Hardware: | H/S: Standard |
| Software | |
|---|---|
| Power Management: | Enabled (see SUT Notes) |
| Operating System (OS): | Windows Server 2012 R2 Datacenter |
| OS Version: | Version 6.3 (Build 9600) |
| Filesystem: | NTFS |
| JVM Vendor: | Oracle Corporation |
| JVM Version: | Oracle Java HotSpot(TM) 64-Bit Server VM (build 24.80-b11, mixed mode), version 1.7.0_80 |
| JVM Command-line Options: | -server -Xmn21000m -Xms24000m -Xmx24000m -XX:SurvivorRatio=1 -XX:TargetSurvivorRatio=99 -XX:AllocatePrefetchDistance=256 -XX:AllocatePrefetchLines=4 -XX:LoopUnrollLimit=45 -XX:InitialTenuringThreshold=12 -XX:MaxTenuringThreshold=15 -XX:ParallelGCThreads=28 -XX:InlineSmallCode=3900 -XX:MaxInlineSize=270 -XX:FreqInlineSize=2500 -XX:+AggressiveOpts -XX:+UseLargePages -XX:+UseParallelOldGC |
| JVM Affinity: | start /NODE [0,1,2,3] /AFFINITY [0xFFFFFFF] |
| JVM Instances: | 4 |
| JVM Initial Heap (MB): | 24000 |
| JVM Maximum Heap (MB): | 24000 |
| JVM Address Bits: | 64 |
| Boot Firmware Version: | I42 v2.00 (02/02/2019) |
| Management Firmware Version: | 1.40 Feb 05 2019 |
| Workload Version: | SSJ 1.2.10 |
| Director Location: | Controller |
| Other Software: | HPE Service Pack for ProLiant (SPP) Version: 2019.03.0, Microsoft Windows KB4056898, KB4338815 |
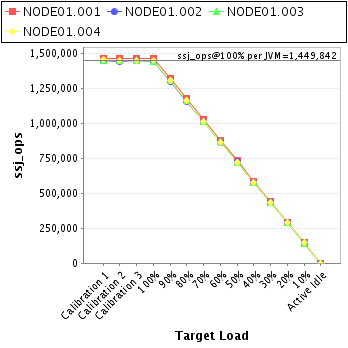
| JVM Instance | ssj_ops@100% |
|---|---|
| NODE01.001 | 1,462,863 |
| NODE01.002 | 1,444,195 |
| NODE01.003 | 1,443,705 |
| NODE01.004 | 1,448,604 |
| ssj_ops@100% | 5,799,368 |
| ssj_ops@100% per JVM | 1,449,842 |
| Target Load | Actual Load | ssj_ops | |
|---|---|---|---|
| Target | Actual | ||
| Calibration 1 | 1,468,217 | ||
| Calibration 2 | 1,467,278 | ||
| Calibration 3 | 1,468,154 | ||
| ssj_ops@calibrated=1,467,716 | |||
| 100% | 99.7% | 1,467,716 | 1,462,863 |
| 90% | 90.0% | 1,320,944 | 1,320,376 |
| 80% | 80.2% | 1,174,173 | 1,176,487 |
| 70% | 69.9% | 1,027,401 | 1,025,697 |
| 60% | 60.1% | 880,629 | 881,976 |
| 50% | 50.1% | 733,858 | 735,226 |
| 40% | 40.0% | 587,086 | 587,436 |
| 30% | 30.0% | 440,315 | 440,303 |
| 20% | 20.0% | 293,543 | 294,079 |
| 10% | 10.0% | 146,772 | 146,355 |
| Active Idle | 0 | 0 | |

| Target Load | Actual Load | ssj_ops | |
|---|---|---|---|
| Target | Actual | ||
| Calibration 1 | 1,448,430 | ||
| Calibration 2 | 1,447,955 | ||
| Calibration 3 | 1,450,568 | ||
| ssj_ops@calibrated=1,449,262 | |||
| 100% | 99.7% | 1,449,262 | 1,444,195 |
| 90% | 89.9% | 1,304,335 | 1,302,246 |
| 80% | 80.1% | 1,159,409 | 1,160,717 |
| 70% | 70.2% | 1,014,483 | 1,016,978 |
| 60% | 59.7% | 869,557 | 865,928 |
| 50% | 50.0% | 724,631 | 725,024 |
| 40% | 40.0% | 579,705 | 579,179 |
| 30% | 29.9% | 434,778 | 433,660 |
| 20% | 20.0% | 289,852 | 289,709 |
| 10% | 10.0% | 144,926 | 144,772 |
| Active Idle | 0 | 0 | |

| Target Load | Actual Load | ssj_ops | |
|---|---|---|---|
| Target | Actual | ||
| Calibration 1 | 1,451,285 | ||
| Calibration 2 | 1,448,925 | ||
| Calibration 3 | 1,450,678 | ||
| ssj_ops@calibrated=1,449,802 | |||
| 100% | 99.6% | 1,449,802 | 1,443,705 |
| 90% | 90.0% | 1,304,821 | 1,305,352 |
| 80% | 80.2% | 1,159,841 | 1,162,199 |
| 70% | 70.1% | 1,014,861 | 1,016,733 |
| 60% | 60.0% | 869,881 | 869,200 |
| 50% | 49.8% | 724,901 | 722,470 |
| 40% | 40.1% | 579,921 | 580,948 |
| 30% | 29.9% | 434,940 | 432,884 |
| 20% | 20.0% | 289,960 | 290,259 |
| 10% | 10.0% | 144,980 | 144,748 |
| Active Idle | 0 | 0 | |

| Target Load | Actual Load | ssj_ops | |
|---|---|---|---|
| Target | Actual | ||
| Calibration 1 | 1,455,853 | ||
| Calibration 2 | 1,451,155 | ||
| Calibration 3 | 1,452,693 | ||
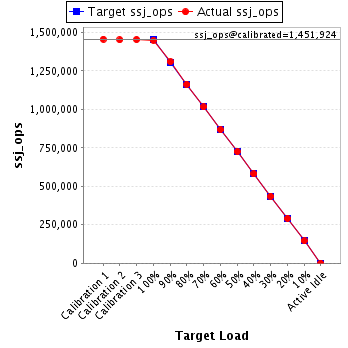
| ssj_ops@calibrated=1,451,924 | |||
| 100% | 99.8% | 1,451,924 | 1,448,604 |
| 90% | 90.2% | 1,306,731 | 1,309,445 |
| 80% | 80.1% | 1,161,539 | 1,162,531 |
| 70% | 69.9% | 1,016,347 | 1,015,363 |
| 60% | 59.7% | 871,154 | 867,249 |
| 50% | 49.9% | 725,962 | 724,870 |
| 40% | 40.0% | 580,770 | 580,262 |
| 30% | 30.1% | 435,577 | 436,387 |
| 20% | 20.0% | 290,385 | 290,844 |
| 10% | 10.0% | 145,192 | 145,143 |
| Active Idle | 0 | 0 | |