SPECpower_ssj2008
Host 'NODE02' Performance Report
Copyright © 2007-2019 Standard Performance Evaluation Corporation
| Hewlett Packard Enterprise Synergy 480 Gen10 Compute Module | ssj_ops@100% = 5,766,301 ssj_ops@100% per JVM = 1,441,575 |
||||
| Test Sponsor: | Hewlett Packard Enterprise | SPEC License #: | 3 | Test Method: | Multi Node |
| Tested By: | Hewlett Packard Enterprise | Test Location: | Houston, TX, USA | Test Date: | Mar 26, 2019 |
| Hardware Availability: | Apr-2019 | Software Availability: | Mar-2019 | Publication: | May 8, 2019 |
| System Source: | Single Supplier | System Designation: | Server | Power Provisioning: | Line-powered |
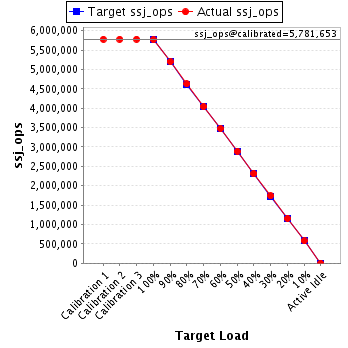
| Target Load | Actual Load | ssj_ops | |
|---|---|---|---|
| Target | Actual | ||
| Calibration 1 | 5,780,677 | ||
| Calibration 2 | 5,781,209 | ||
| Calibration 3 | 5,782,097 | ||
| ssj_ops@calibrated=5,781,653 | |||
| 100% | 99.7% | 5,781,653 | 5,766,301 |
| 90% | 90.0% | 5,203,488 | 5,200,847 |
| 80% | 80.1% | 4,625,323 | 4,628,963 |
| 70% | 70.0% | 4,047,157 | 4,044,568 |
| 60% | 60.1% | 3,468,992 | 3,473,717 |
| 50% | 50.0% | 2,890,827 | 2,888,617 |
| 40% | 40.0% | 2,312,661 | 2,309,910 |
| 30% | 30.0% | 1,734,496 | 1,736,605 |
| 20% | 20.0% | 1,156,331 | 1,155,274 |
| 10% | 10.0% | 578,165 | 576,958 |
| Active Idle | 0 | 0 | |
| Set Identifier: | SUT |
| Set Description: | System Under Test |
| # of Identical Nodes: | 11 |
| Comment: | SUT |
| Hardware | |
|---|---|
| Hardware Vendor: | Hewlett Packard Enterprise |
| Model: | Synergy 480 Gen10 Compute Module |
| Form Factor: | 7U |
| CPU Name: | Intel Xeon Platinum 8280 @ 2.70GHz (Intel Turbo Boost Technology up to 4.00 GHz) |
| CPU Characteristics: | 28-Core, 2.70 GHz, 38.5MB L3 Cache |
| CPU Frequency (MHz): | 2700 |
| CPU(s) Enabled: | 56 cores, 2 chips, 28 cores/chip |
| Hardware Threads: | 112 (2 / core) |
| CPU(s) Orderable: | 1,2 chips |
| Primary Cache: | 32 KB I + 32 KB D on chip per core |
| Secondary Cache: | 1 MB I+D on chip per core |
| Tertiary Cache: | 39424 KB I+D on chip per chip |
| Other Cache: | None |
| Memory Amount (GB): | 192 |
| # and size of DIMM: | 12 x 16384 MB |
| Memory Details: | 12 x 16GB 2Rx8 PC4-2933Y-R; slots 1, 3, 5, 8, 10 and 12 populated in each socket |
| Power Supply Quantity and Rating (W): | None |
| Power Supply Details: | N/A |
| Disk Drive: | 1 x HPE 240GB 6G SATA M.2 SSD (875488-B21) |
| Disk Controller: | HPE Smart Array S100i SR Gen10 |
| # and type of Network Interface Cards (NICs) Installed: | 1 x HPE Synergy 3820C 10/20Gb CNA |
| NICs Enabled in Firmware / OS / Connected: | 2/2/1 |
| Network Speed (Mbit): | 1000 |
| Keyboard: | None |
| Mouse: | None |
| Monitor: | None |
| Optical Drives: | No |
| Other Hardware: | H/S: Standard |
| Software | |
|---|---|
| Power Management: | Enabled (see SUT Notes) |
| Operating System (OS): | Windows Server 2012 R2 Datacenter |
| OS Version: | Version 6.3 (Build 9600) |
| Filesystem: | NTFS |
| JVM Vendor: | Oracle Corporation |
| JVM Version: | Oracle Java HotSpot(TM) 64-Bit Server VM (build 24.80-b11, mixed mode), version 1.7.0_80 |
| JVM Command-line Options: | -server -Xmn21000m -Xms24000m -Xmx24000m -XX:SurvivorRatio=1 -XX:TargetSurvivorRatio=99 -XX:AllocatePrefetchDistance=256 -XX:AllocatePrefetchLines=4 -XX:LoopUnrollLimit=45 -XX:InitialTenuringThreshold=12 -XX:MaxTenuringThreshold=15 -XX:ParallelGCThreads=28 -XX:InlineSmallCode=3900 -XX:MaxInlineSize=270 -XX:FreqInlineSize=2500 -XX:+AggressiveOpts -XX:+UseLargePages -XX:+UseParallelOldGC |
| JVM Affinity: | start /NODE [0,1,2,3] /AFFINITY [0xFFFFFFF] |
| JVM Instances: | 4 |
| JVM Initial Heap (MB): | 24000 |
| JVM Maximum Heap (MB): | 24000 |
| JVM Address Bits: | 64 |
| Boot Firmware Version: | I42 v2.00 (02/02/2019) |
| Management Firmware Version: | 1.40 Feb 05 2019 |
| Workload Version: | SSJ 1.2.10 |
| Director Location: | Controller |
| Other Software: | HPE Service Pack for ProLiant (SPP) Version: 2019.03.0, Microsoft Windows KB4056898, KB4338815 |
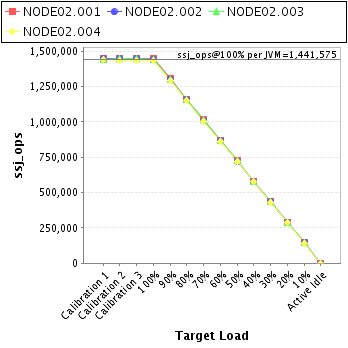
| JVM Instance | ssj_ops@100% |
|---|---|
| NODE02.001 | 1,447,180 |
| NODE02.002 | 1,443,339 |
| NODE02.003 | 1,443,141 |
| NODE02.004 | 1,432,641 |
| ssj_ops@100% | 5,766,301 |
| ssj_ops@100% per JVM | 1,441,575 |
| Target Load | Actual Load | ssj_ops | |
|---|---|---|---|
| Target | Actual | ||
| Calibration 1 | 1,450,768 | ||
| Calibration 2 | 1,449,930 | ||
| Calibration 3 | 1,448,679 | ||
| ssj_ops@calibrated=1,449,305 | |||
| 100% | 99.9% | 1,449,305 | 1,447,180 |
| 90% | 90.0% | 1,304,374 | 1,304,531 |
| 80% | 80.1% | 1,159,444 | 1,160,480 |
| 70% | 70.0% | 1,014,513 | 1,014,357 |
| 60% | 60.1% | 869,583 | 871,363 |
| 50% | 50.1% | 724,652 | 726,375 |
| 40% | 40.0% | 579,722 | 579,464 |
| 30% | 30.0% | 434,791 | 435,253 |
| 20% | 19.9% | 289,861 | 288,361 |
| 10% | 9.9% | 144,930 | 143,847 |
| Active Idle | 0 | 0 | |
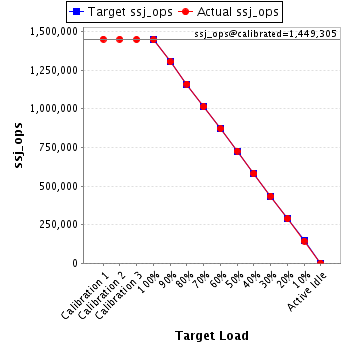
| Target Load | Actual Load | ssj_ops | |
|---|---|---|---|
| Target | Actual | ||
| Calibration 1 | 1,448,019 | ||
| Calibration 2 | 1,447,091 | ||
| Calibration 3 | 1,449,633 | ||
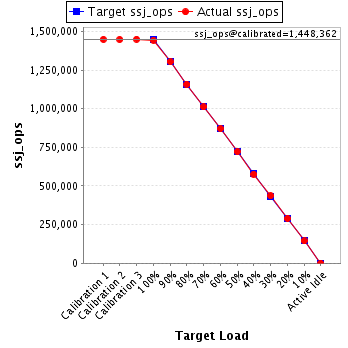
| ssj_ops@calibrated=1,448,362 | |||
| 100% | 99.7% | 1,448,362 | 1,443,339 |
| 90% | 90.0% | 1,303,526 | 1,303,448 |
| 80% | 79.9% | 1,158,689 | 1,157,862 |
| 70% | 69.8% | 1,013,853 | 1,011,199 |
| 60% | 60.1% | 869,017 | 870,144 |
| 50% | 49.8% | 724,181 | 721,459 |
| 40% | 39.8% | 579,345 | 576,258 |
| 30% | 30.1% | 434,509 | 435,564 |
| 20% | 20.0% | 289,672 | 289,338 |
| 10% | 10.0% | 144,836 | 144,307 |
| Active Idle | 0 | 0 | |
| Target Load | Actual Load | ssj_ops | |
|---|---|---|---|
| Target | Actual | ||
| Calibration 1 | 1,443,824 | ||
| Calibration 2 | 1,448,293 | ||
| Calibration 3 | 1,446,828 | ||
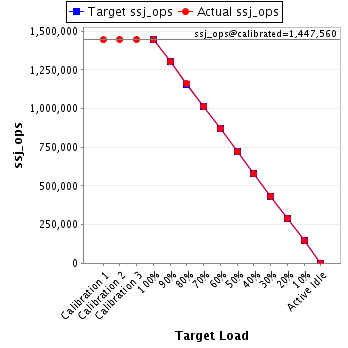
| ssj_ops@calibrated=1,447,560 | |||
| 100% | 99.7% | 1,447,560 | 1,443,141 |
| 90% | 89.9% | 1,302,804 | 1,301,067 |
| 80% | 80.2% | 1,158,048 | 1,161,149 |
| 70% | 70.0% | 1,013,292 | 1,013,926 |
| 60% | 60.1% | 868,536 | 870,105 |
| 50% | 50.0% | 723,780 | 723,514 |
| 40% | 39.9% | 579,024 | 578,065 |
| 30% | 30.0% | 434,268 | 434,623 |
| 20% | 20.0% | 289,512 | 290,121 |
| 10% | 10.1% | 144,756 | 145,503 |
| Active Idle | 0 | 0 | |
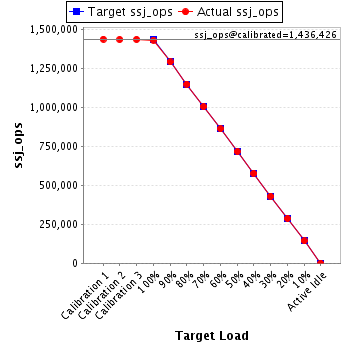
| Target Load | Actual Load | ssj_ops | |
|---|---|---|---|
| Target | Actual | ||
| Calibration 1 | 1,438,065 | ||
| Calibration 2 | 1,435,895 | ||
| Calibration 3 | 1,436,957 | ||
| ssj_ops@calibrated=1,436,426 | |||
| 100% | 99.7% | 1,436,426 | 1,432,641 |
| 90% | 89.9% | 1,292,784 | 1,291,802 |
| 80% | 80.0% | 1,149,141 | 1,149,472 |
| 70% | 70.0% | 1,005,498 | 1,005,086 |
| 60% | 60.0% | 861,856 | 862,106 |
| 50% | 49.9% | 718,213 | 717,269 |
| 40% | 40.1% | 574,571 | 576,124 |
| 30% | 30.0% | 430,928 | 431,164 |
| 20% | 20.0% | 287,285 | 287,453 |
| 10% | 10.0% | 143,643 | 143,301 |
| Active Idle | 0 | 0 | |