
SPECpower_ssj2008
Host 'NODE04' Performance Report
Copyright © 2007-2019 Standard Performance Evaluation Corporation
| Hewlett Packard Enterprise Synergy 480 Gen10 Compute Module | ssj_ops@100% = 5,764,716 ssj_ops@100% per JVM = 1,441,179 |
||||
| Test Sponsor: | Hewlett Packard Enterprise | SPEC License #: | 3 | Test Method: | Multi Node |
| Tested By: | Hewlett Packard Enterprise | Test Location: | Houston, TX, USA | Test Date: | Mar 26, 2019 |
| Hardware Availability: | Apr-2019 | Software Availability: | Mar-2019 | Publication: | May 8, 2019 |
| System Source: | Single Supplier | System Designation: | Server | Power Provisioning: | Line-powered |
| Target Load | Actual Load | ssj_ops | |
|---|---|---|---|
| Target | Actual | ||
| Calibration 1 | 5,788,835 | ||
| Calibration 2 | 5,783,846 | ||
| Calibration 3 | 5,795,421 | ||
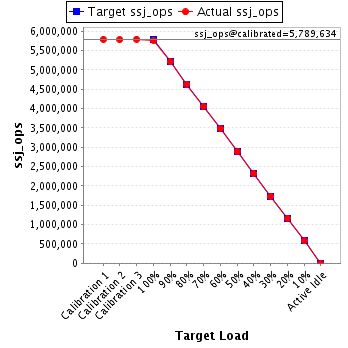
| ssj_ops@calibrated=5,789,634 | |||
| 100% | 99.6% | 5,789,634 | 5,764,716 |
| 90% | 90.0% | 5,210,670 | 5,213,531 |
| 80% | 80.0% | 4,631,707 | 4,634,435 |
| 70% | 70.1% | 4,052,744 | 4,058,912 |
| 60% | 60.1% | 3,473,780 | 3,476,980 |
| 50% | 50.0% | 2,894,817 | 2,894,750 |
| 40% | 40.0% | 2,315,854 | 2,316,951 |
| 30% | 29.9% | 1,736,890 | 1,733,693 |
| 20% | 20.0% | 1,157,927 | 1,156,228 |
| 10% | 10.0% | 578,963 | 579,756 |
| Active Idle | 0 | 0 | |
| Set Identifier: | SUT |
| Set Description: | System Under Test |
| # of Identical Nodes: | 11 |
| Comment: | SUT |
| Hardware | |
|---|---|
| Hardware Vendor: | Hewlett Packard Enterprise |
| Model: | Synergy 480 Gen10 Compute Module |
| Form Factor: | 7U |
| CPU Name: | Intel Xeon Platinum 8280 @ 2.70GHz (Intel Turbo Boost Technology up to 4.00 GHz) |
| CPU Characteristics: | 28-Core, 2.70 GHz, 38.5MB L3 Cache |
| CPU Frequency (MHz): | 2700 |
| CPU(s) Enabled: | 56 cores, 2 chips, 28 cores/chip |
| Hardware Threads: | 112 (2 / core) |
| CPU(s) Orderable: | 1,2 chips |
| Primary Cache: | 32 KB I + 32 KB D on chip per core |
| Secondary Cache: | 1 MB I+D on chip per core |
| Tertiary Cache: | 39424 KB I+D on chip per chip |
| Other Cache: | None |
| Memory Amount (GB): | 192 |
| # and size of DIMM: | 12 x 16384 MB |
| Memory Details: | 12 x 16GB 2Rx8 PC4-2933Y-R; slots 1, 3, 5, 8, 10 and 12 populated in each socket |
| Power Supply Quantity and Rating (W): | None |
| Power Supply Details: | N/A |
| Disk Drive: | 1 x HPE 240GB 6G SATA M.2 SSD (875488-B21) |
| Disk Controller: | HPE Smart Array S100i SR Gen10 |
| # and type of Network Interface Cards (NICs) Installed: | 1 x HPE Synergy 3820C 10/20Gb CNA |
| NICs Enabled in Firmware / OS / Connected: | 2/2/1 |
| Network Speed (Mbit): | 1000 |
| Keyboard: | None |
| Mouse: | None |
| Monitor: | None |
| Optical Drives: | No |
| Other Hardware: | H/S: Standard |
| Software | |
|---|---|
| Power Management: | Enabled (see SUT Notes) |
| Operating System (OS): | Windows Server 2012 R2 Datacenter |
| OS Version: | Version 6.3 (Build 9600) |
| Filesystem: | NTFS |
| JVM Vendor: | Oracle Corporation |
| JVM Version: | Oracle Java HotSpot(TM) 64-Bit Server VM (build 24.80-b11, mixed mode), version 1.7.0_80 |
| JVM Command-line Options: | -server -Xmn21000m -Xms24000m -Xmx24000m -XX:SurvivorRatio=1 -XX:TargetSurvivorRatio=99 -XX:AllocatePrefetchDistance=256 -XX:AllocatePrefetchLines=4 -XX:LoopUnrollLimit=45 -XX:InitialTenuringThreshold=12 -XX:MaxTenuringThreshold=15 -XX:ParallelGCThreads=28 -XX:InlineSmallCode=3900 -XX:MaxInlineSize=270 -XX:FreqInlineSize=2500 -XX:+AggressiveOpts -XX:+UseLargePages -XX:+UseParallelOldGC |
| JVM Affinity: | start /NODE [0,1,2,3] /AFFINITY [0xFFFFFFF] |
| JVM Instances: | 4 |
| JVM Initial Heap (MB): | 24000 |
| JVM Maximum Heap (MB): | 24000 |
| JVM Address Bits: | 64 |
| Boot Firmware Version: | I42 v2.00 (02/02/2019) |
| Management Firmware Version: | 1.40 Feb 05 2019 |
| Workload Version: | SSJ 1.2.10 |
| Director Location: | Controller |
| Other Software: | HPE Service Pack for ProLiant (SPP) Version: 2019.03.0, Microsoft Windows KB4056898, KB4338815 |
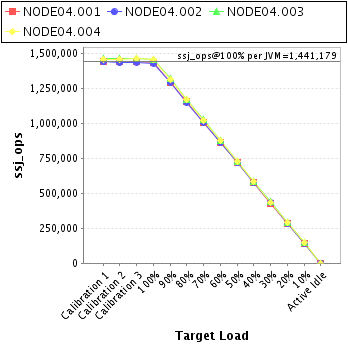
| JVM Instance | ssj_ops@100% |
|---|---|
| NODE04.001 | 1,431,564 |
| NODE04.002 | 1,428,072 |
| NODE04.003 | 1,454,598 |
| NODE04.004 | 1,450,481 |
| ssj_ops@100% | 5,764,716 |
| ssj_ops@100% per JVM | 1,441,179 |
| Target Load | Actual Load | ssj_ops | |
|---|---|---|---|
| Target | Actual | ||
| Calibration 1 | 1,438,598 | ||
| Calibration 2 | 1,435,976 | ||
| Calibration 3 | 1,438,809 | ||
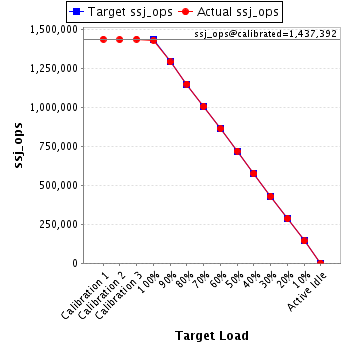
| ssj_ops@calibrated=1,437,392 | |||
| 100% | 99.6% | 1,437,392 | 1,431,564 |
| 90% | 89.9% | 1,293,653 | 1,292,345 |
| 80% | 80.0% | 1,149,914 | 1,150,596 |
| 70% | 70.1% | 1,006,175 | 1,007,494 |
| 60% | 60.1% | 862,435 | 863,629 |
| 50% | 50.1% | 718,696 | 720,611 |
| 40% | 40.0% | 574,957 | 574,671 |
| 30% | 29.9% | 431,218 | 429,936 |
| 20% | 20.0% | 287,478 | 286,781 |
| 10% | 10.0% | 143,739 | 143,305 |
| Active Idle | 0 | 0 | |
| Target Load | Actual Load | ssj_ops | |
|---|---|---|---|
| Target | Actual | ||
| Calibration 1 | 1,435,999 | ||
| Calibration 2 | 1,432,910 | ||
| Calibration 3 | 1,435,643 | ||
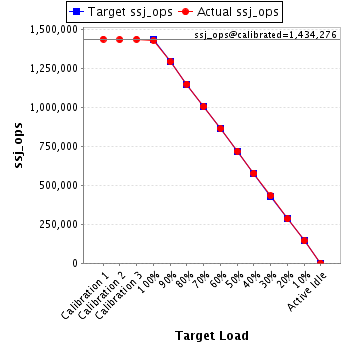
| ssj_ops@calibrated=1,434,276 | |||
| 100% | 99.6% | 1,434,276 | 1,428,072 |
| 90% | 90.0% | 1,290,849 | 1,291,386 |
| 80% | 80.0% | 1,147,421 | 1,148,014 |
| 70% | 70.1% | 1,003,993 | 1,004,762 |
| 60% | 60.1% | 860,566 | 862,668 |
| 50% | 50.0% | 717,138 | 717,619 |
| 40% | 40.2% | 573,711 | 576,187 |
| 30% | 30.1% | 430,283 | 431,327 |
| 20% | 19.8% | 286,855 | 284,045 |
| 10% | 10.0% | 143,428 | 143,891 |
| Active Idle | 0 | 0 | |
| Target Load | Actual Load | ssj_ops | |
|---|---|---|---|
| Target | Actual | ||
| Calibration 1 | 1,459,342 | ||
| Calibration 2 | 1,459,898 | ||
| Calibration 3 | 1,463,224 | ||
| ssj_ops@calibrated=1,461,561 | |||
| 100% | 99.5% | 1,461,561 | 1,454,598 |
| 90% | 90.2% | 1,315,405 | 1,318,622 |
| 80% | 80.1% | 1,169,249 | 1,170,023 |
| 70% | 70.2% | 1,023,093 | 1,026,254 |
| 60% | 60.0% | 876,937 | 876,557 |
| 50% | 49.8% | 730,780 | 727,586 |
| 40% | 39.9% | 584,624 | 583,063 |
| 30% | 30.0% | 438,468 | 438,504 |
| 20% | 20.0% | 292,312 | 291,864 |
| 10% | 10.0% | 146,156 | 146,283 |
| Active Idle | 0 | 0 | |

| Target Load | Actual Load | ssj_ops | |
|---|---|---|---|
| Target | Actual | ||
| Calibration 1 | 1,454,897 | ||
| Calibration 2 | 1,455,063 | ||
| Calibration 3 | 1,457,745 | ||
| ssj_ops@calibrated=1,456,404 | |||
| 100% | 99.6% | 1,456,404 | 1,450,481 |
| 90% | 90.0% | 1,310,764 | 1,311,178 |
| 80% | 80.0% | 1,165,123 | 1,165,803 |
| 70% | 70.1% | 1,019,483 | 1,020,402 |
| 60% | 60.0% | 873,843 | 874,126 |
| 50% | 50.1% | 728,202 | 728,935 |
| 40% | 40.0% | 582,562 | 583,030 |
| 30% | 29.8% | 436,921 | 433,926 |
| 20% | 20.2% | 291,281 | 293,538 |
| 10% | 10.0% | 145,640 | 146,277 |
| Active Idle | 0 | 0 | |
