SPECpower_ssj2008
Host 'NODE09' Performance Report
Copyright © 2007-2019 Standard Performance Evaluation Corporation
| Hewlett Packard Enterprise Synergy 480 Gen10 Compute Module | ssj_ops@100% = 5,724,040 ssj_ops@100% per JVM = 1,431,010 |
||||
| Test Sponsor: | Hewlett Packard Enterprise | SPEC License #: | 3 | Test Method: | Multi Node |
| Tested By: | Hewlett Packard Enterprise | Test Location: | Houston, TX, USA | Test Date: | Mar 26, 2019 |
| Hardware Availability: | Apr-2019 | Software Availability: | Mar-2019 | Publication: | May 8, 2019 |
| System Source: | Single Supplier | System Designation: | Server | Power Provisioning: | Line-powered |
| Target Load | Actual Load | ssj_ops | |
|---|---|---|---|
| Target | Actual | ||
| Calibration 1 | 5,745,023 | ||
| Calibration 2 | 5,730,513 | ||
| Calibration 3 | 5,739,365 | ||
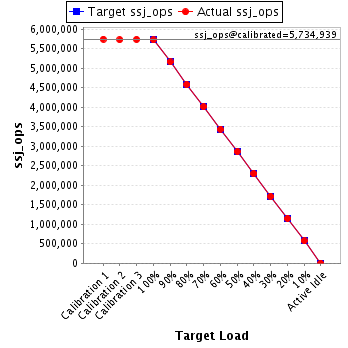
| ssj_ops@calibrated=5,734,939 | |||
| 100% | 99.8% | 5,734,939 | 5,724,040 |
| 90% | 90.0% | 5,161,445 | 5,160,121 |
| 80% | 79.9% | 4,587,951 | 4,583,206 |
| 70% | 70.0% | 4,014,457 | 4,012,852 |
| 60% | 60.0% | 3,440,963 | 3,440,846 |
| 50% | 49.9% | 2,867,469 | 2,862,724 |
| 40% | 40.0% | 2,293,976 | 2,296,167 |
| 30% | 30.0% | 1,720,482 | 1,718,217 |
| 20% | 20.0% | 1,146,988 | 1,146,587 |
| 10% | 10.0% | 573,494 | 573,002 |
| Active Idle | 0 | 0 | |
| Set Identifier: | SUT |
| Set Description: | System Under Test |
| # of Identical Nodes: | 11 |
| Comment: | SUT |
| Hardware | |
|---|---|
| Hardware Vendor: | Hewlett Packard Enterprise |
| Model: | Synergy 480 Gen10 Compute Module |
| Form Factor: | 7U |
| CPU Name: | Intel Xeon Platinum 8280 @ 2.70GHz (Intel Turbo Boost Technology up to 4.00 GHz) |
| CPU Characteristics: | 28-Core, 2.70 GHz, 38.5MB L3 Cache |
| CPU Frequency (MHz): | 2700 |
| CPU(s) Enabled: | 56 cores, 2 chips, 28 cores/chip |
| Hardware Threads: | 112 (2 / core) |
| CPU(s) Orderable: | 1,2 chips |
| Primary Cache: | 32 KB I + 32 KB D on chip per core |
| Secondary Cache: | 1 MB I+D on chip per core |
| Tertiary Cache: | 39424 KB I+D on chip per chip |
| Other Cache: | None |
| Memory Amount (GB): | 192 |
| # and size of DIMM: | 12 x 16384 MB |
| Memory Details: | 12 x 16GB 2Rx8 PC4-2933Y-R; slots 1, 3, 5, 8, 10 and 12 populated in each socket |
| Power Supply Quantity and Rating (W): | None |
| Power Supply Details: | N/A |
| Disk Drive: | 1 x HPE 240GB 6G SATA M.2 SSD (875488-B21) |
| Disk Controller: | HPE Smart Array S100i SR Gen10 |
| # and type of Network Interface Cards (NICs) Installed: | 1 x HPE Synergy 3820C 10/20Gb CNA |
| NICs Enabled in Firmware / OS / Connected: | 2/2/1 |
| Network Speed (Mbit): | 1000 |
| Keyboard: | None |
| Mouse: | None |
| Monitor: | None |
| Optical Drives: | No |
| Other Hardware: | H/S: Standard |
| Software | |
|---|---|
| Power Management: | Enabled (see SUT Notes) |
| Operating System (OS): | Windows Server 2012 R2 Datacenter |
| OS Version: | Version 6.3 (Build 9600) |
| Filesystem: | NTFS |
| JVM Vendor: | Oracle Corporation |
| JVM Version: | Oracle Java HotSpot(TM) 64-Bit Server VM (build 24.80-b11, mixed mode), version 1.7.0_80 |
| JVM Command-line Options: | -server -Xmn21000m -Xms24000m -Xmx24000m -XX:SurvivorRatio=1 -XX:TargetSurvivorRatio=99 -XX:AllocatePrefetchDistance=256 -XX:AllocatePrefetchLines=4 -XX:LoopUnrollLimit=45 -XX:InitialTenuringThreshold=12 -XX:MaxTenuringThreshold=15 -XX:ParallelGCThreads=28 -XX:InlineSmallCode=3900 -XX:MaxInlineSize=270 -XX:FreqInlineSize=2500 -XX:+AggressiveOpts -XX:+UseLargePages -XX:+UseParallelOldGC |
| JVM Affinity: | start /NODE [0,1,2,3] /AFFINITY [0xFFFFFFF] |
| JVM Instances: | 4 |
| JVM Initial Heap (MB): | 24000 |
| JVM Maximum Heap (MB): | 24000 |
| JVM Address Bits: | 64 |
| Boot Firmware Version: | I42 v2.00 (02/02/2019) |
| Management Firmware Version: | 1.40 Feb 05 2019 |
| Workload Version: | SSJ 1.2.10 |
| Director Location: | Controller |
| Other Software: | HPE Service Pack for ProLiant (SPP) Version: 2019.03.0, Microsoft Windows KB4056898, KB4338815 |
| JVM Instance | ssj_ops@100% |
|---|---|
| NODE09.001 | 1,438,560 |
| NODE09.002 | 1,425,769 |
| NODE09.003 | 1,433,269 |
| NODE09.004 | 1,426,442 |
| ssj_ops@100% | 5,724,040 |
| ssj_ops@100% per JVM | 1,431,010 |

| Target Load | Actual Load | ssj_ops | |
|---|---|---|---|
| Target | Actual | ||
| Calibration 1 | 1,444,999 | ||
| Calibration 2 | 1,441,947 | ||
| Calibration 3 | 1,443,152 | ||
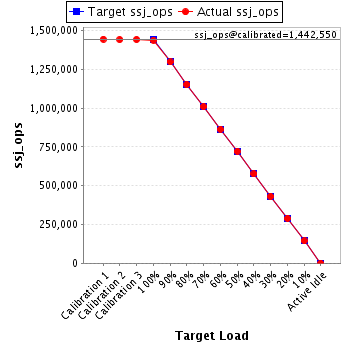
| ssj_ops@calibrated=1,442,550 | |||
| 100% | 99.7% | 1,442,550 | 1,438,560 |
| 90% | 90.0% | 1,298,295 | 1,297,909 |
| 80% | 79.9% | 1,154,040 | 1,152,956 |
| 70% | 70.0% | 1,009,785 | 1,009,822 |
| 60% | 60.0% | 865,530 | 864,905 |
| 50% | 50.0% | 721,275 | 721,917 |
| 40% | 39.9% | 577,020 | 575,726 |
| 30% | 29.9% | 432,765 | 431,492 |
| 20% | 20.0% | 288,510 | 289,192 |
| 10% | 10.0% | 144,255 | 144,385 |
| Active Idle | 0 | 0 | |
| Target Load | Actual Load | ssj_ops | |
|---|---|---|---|
| Target | Actual | ||
| Calibration 1 | 1,429,729 | ||
| Calibration 2 | 1,429,177 | ||
| Calibration 3 | 1,430,023 | ||
| ssj_ops@calibrated=1,429,600 | |||
| 100% | 99.7% | 1,429,600 | 1,425,769 |
| 90% | 90.0% | 1,286,640 | 1,286,909 |
| 80% | 80.1% | 1,143,680 | 1,144,758 |
| 70% | 69.9% | 1,000,720 | 999,670 |
| 60% | 60.0% | 857,760 | 857,448 |
| 50% | 49.9% | 714,800 | 712,757 |
| 40% | 40.1% | 571,840 | 573,012 |
| 30% | 30.0% | 428,880 | 429,195 |
| 20% | 19.9% | 285,920 | 284,898 |
| 10% | 10.0% | 142,960 | 142,616 |
| Active Idle | 0 | 0 | |

| Target Load | Actual Load | ssj_ops | |
|---|---|---|---|
| Target | Actual | ||
| Calibration 1 | 1,437,405 | ||
| Calibration 2 | 1,433,137 | ||
| Calibration 3 | 1,436,885 | ||
| ssj_ops@calibrated=1,435,011 | |||
| 100% | 99.9% | 1,435,011 | 1,433,269 |
| 90% | 90.0% | 1,291,510 | 1,290,864 |
| 80% | 79.6% | 1,148,009 | 1,142,337 |
| 70% | 70.2% | 1,004,507 | 1,006,729 |
| 60% | 60.0% | 861,006 | 860,968 |
| 50% | 50.0% | 717,505 | 717,174 |
| 40% | 40.0% | 574,004 | 574,302 |
| 30% | 29.9% | 430,503 | 429,217 |
| 20% | 19.9% | 287,002 | 286,031 |
| 10% | 10.0% | 143,501 | 143,999 |
| Active Idle | 0 | 0 | |

| Target Load | Actual Load | ssj_ops | |
|---|---|---|---|
| Target | Actual | ||
| Calibration 1 | 1,432,890 | ||
| Calibration 2 | 1,426,252 | ||
| Calibration 3 | 1,429,304 | ||
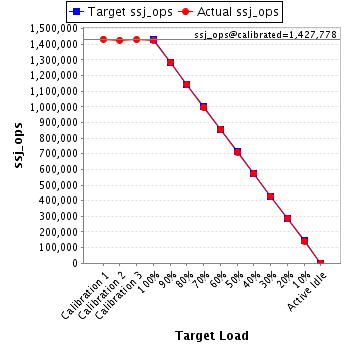
| ssj_ops@calibrated=1,427,778 | |||
| 100% | 99.9% | 1,427,778 | 1,426,442 |
| 90% | 90.0% | 1,285,000 | 1,284,439 |
| 80% | 80.1% | 1,142,223 | 1,143,156 |
| 70% | 69.8% | 999,445 | 996,631 |
| 60% | 60.1% | 856,667 | 857,524 |
| 50% | 49.8% | 713,889 | 710,876 |
| 40% | 40.1% | 571,111 | 573,126 |
| 30% | 30.0% | 428,333 | 428,314 |
| 20% | 20.1% | 285,556 | 286,466 |
| 10% | 9.9% | 142,778 | 142,002 |
| Active Idle | 0 | 0 | |