SPECpower_ssj2008
Host 'NODE10' Performance Report
Copyright © 2007-2019 Standard Performance Evaluation Corporation
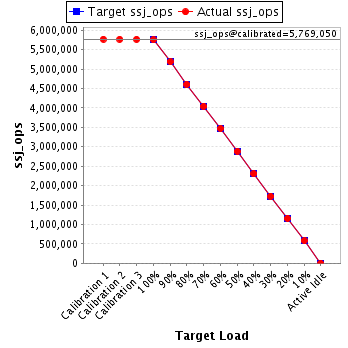
| Hewlett Packard Enterprise Synergy 480 Gen10 Compute Module | ssj_ops@100% = 5,753,223 ssj_ops@100% per JVM = 1,438,306 |
||||
| Test Sponsor: | Hewlett Packard Enterprise | SPEC License #: | 3 | Test Method: | Multi Node |
| Tested By: | Hewlett Packard Enterprise | Test Location: | Houston, TX, USA | Test Date: | Mar 26, 2019 |
| Hardware Availability: | Apr-2019 | Software Availability: | Mar-2019 | Publication: | May 8, 2019 |
| System Source: | Single Supplier | System Designation: | Server | Power Provisioning: | Line-powered |
| Target Load | Actual Load | ssj_ops | |
|---|---|---|---|
| Target | Actual | ||
| Calibration 1 | 5,771,525 | ||
| Calibration 2 | 5,768,130 | ||
| Calibration 3 | 5,769,969 | ||
| ssj_ops@calibrated=5,769,050 | |||
| 100% | 99.7% | 5,769,050 | 5,753,223 |
| 90% | 90.0% | 5,192,145 | 5,189,486 |
| 80% | 79.9% | 4,615,240 | 4,607,922 |
| 70% | 70.1% | 4,038,335 | 4,045,518 |
| 60% | 60.2% | 3,461,430 | 3,470,456 |
| 50% | 50.0% | 2,884,525 | 2,886,454 |
| 40% | 39.9% | 2,307,620 | 2,302,318 |
| 30% | 30.0% | 1,730,715 | 1,729,423 |
| 20% | 20.0% | 1,153,810 | 1,154,730 |
| 10% | 10.1% | 576,905 | 580,337 |
| Active Idle | 0 | 0 | |
| Set Identifier: | SUT |
| Set Description: | System Under Test |
| # of Identical Nodes: | 11 |
| Comment: | SUT |
| Hardware | |
|---|---|
| Hardware Vendor: | Hewlett Packard Enterprise |
| Model: | Synergy 480 Gen10 Compute Module |
| Form Factor: | 7U |
| CPU Name: | Intel Xeon Platinum 8280 @ 2.70GHz (Intel Turbo Boost Technology up to 4.00 GHz) |
| CPU Characteristics: | 28-Core, 2.70 GHz, 38.5MB L3 Cache |
| CPU Frequency (MHz): | 2700 |
| CPU(s) Enabled: | 56 cores, 2 chips, 28 cores/chip |
| Hardware Threads: | 112 (2 / core) |
| CPU(s) Orderable: | 1,2 chips |
| Primary Cache: | 32 KB I + 32 KB D on chip per core |
| Secondary Cache: | 1 MB I+D on chip per core |
| Tertiary Cache: | 39424 KB I+D on chip per chip |
| Other Cache: | None |
| Memory Amount (GB): | 192 |
| # and size of DIMM: | 12 x 16384 MB |
| Memory Details: | 12 x 16GB 2Rx8 PC4-2933Y-R; slots 1, 3, 5, 8, 10 and 12 populated in each socket |
| Power Supply Quantity and Rating (W): | None |
| Power Supply Details: | N/A |
| Disk Drive: | 1 x HPE 240GB 6G SATA M.2 SSD (875488-B21) |
| Disk Controller: | HPE Smart Array S100i SR Gen10 |
| # and type of Network Interface Cards (NICs) Installed: | 1 x HPE Synergy 3820C 10/20Gb CNA |
| NICs Enabled in Firmware / OS / Connected: | 2/2/1 |
| Network Speed (Mbit): | 1000 |
| Keyboard: | None |
| Mouse: | None |
| Monitor: | None |
| Optical Drives: | No |
| Other Hardware: | H/S: Standard |
| Software | |
|---|---|
| Power Management: | Enabled (see SUT Notes) |
| Operating System (OS): | Windows Server 2012 R2 Datacenter |
| OS Version: | Version 6.3 (Build 9600) |
| Filesystem: | NTFS |
| JVM Vendor: | Oracle Corporation |
| JVM Version: | Oracle Java HotSpot(TM) 64-Bit Server VM (build 24.80-b11, mixed mode), version 1.7.0_80 |
| JVM Command-line Options: | -server -Xmn21000m -Xms24000m -Xmx24000m -XX:SurvivorRatio=1 -XX:TargetSurvivorRatio=99 -XX:AllocatePrefetchDistance=256 -XX:AllocatePrefetchLines=4 -XX:LoopUnrollLimit=45 -XX:InitialTenuringThreshold=12 -XX:MaxTenuringThreshold=15 -XX:ParallelGCThreads=28 -XX:InlineSmallCode=3900 -XX:MaxInlineSize=270 -XX:FreqInlineSize=2500 -XX:+AggressiveOpts -XX:+UseLargePages -XX:+UseParallelOldGC |
| JVM Affinity: | start /NODE [0,1,2,3] /AFFINITY [0xFFFFFFF] |
| JVM Instances: | 4 |
| JVM Initial Heap (MB): | 24000 |
| JVM Maximum Heap (MB): | 24000 |
| JVM Address Bits: | 64 |
| Boot Firmware Version: | I42 v2.00 (02/02/2019) |
| Management Firmware Version: | 1.40 Feb 05 2019 |
| Workload Version: | SSJ 1.2.10 |
| Director Location: | Controller |
| Other Software: | HPE Service Pack for ProLiant (SPP) Version: 2019.03.0, Microsoft Windows KB4056898, KB4338815 |
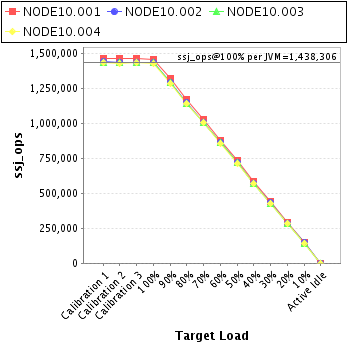
| JVM Instance | ssj_ops@100% |
|---|---|
| NODE10.001 | 1,460,345 |
| NODE10.002 | 1,433,349 |
| NODE10.003 | 1,432,546 |
| NODE10.004 | 1,426,984 |
| ssj_ops@100% | 5,753,223 |
| ssj_ops@100% per JVM | 1,438,306 |
| Target Load | Actual Load | ssj_ops | |
|---|---|---|---|
| Target | Actual | ||
| Calibration 1 | 1,464,683 | ||
| Calibration 2 | 1,466,359 | ||
| Calibration 3 | 1,465,912 | ||
| ssj_ops@calibrated=1,466,136 | |||
| 100% | 99.6% | 1,466,136 | 1,460,345 |
| 90% | 90.0% | 1,319,522 | 1,319,057 |
| 80% | 80.0% | 1,172,908 | 1,173,154 |
| 70% | 70.0% | 1,026,295 | 1,025,963 |
| 60% | 60.1% | 879,681 | 880,731 |
| 50% | 50.1% | 733,068 | 734,004 |
| 40% | 39.9% | 586,454 | 584,817 |
| 30% | 30.0% | 439,841 | 439,868 |
| 20% | 20.0% | 293,227 | 293,186 |
| 10% | 10.0% | 146,614 | 147,235 |
| Active Idle | 0 | 0 | |

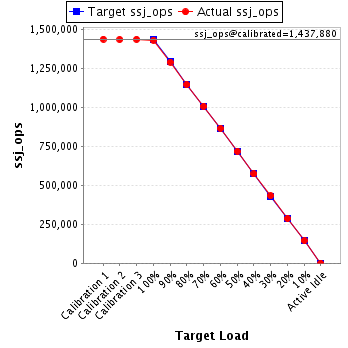
| Target Load | Actual Load | ssj_ops | |
|---|---|---|---|
| Target | Actual | ||
| Calibration 1 | 1,439,234 | ||
| Calibration 2 | 1,437,452 | ||
| Calibration 3 | 1,438,308 | ||
| ssj_ops@calibrated=1,437,880 | |||
| 100% | 99.7% | 1,437,880 | 1,433,349 |
| 90% | 89.9% | 1,294,092 | 1,292,188 |
| 80% | 79.8% | 1,150,304 | 1,147,402 |
| 70% | 70.2% | 1,006,516 | 1,009,063 |
| 60% | 60.3% | 862,728 | 866,980 |
| 50% | 50.0% | 718,940 | 719,143 |
| 40% | 39.9% | 575,152 | 573,430 |
| 30% | 30.1% | 431,364 | 432,495 |
| 20% | 20.0% | 287,576 | 286,934 |
| 10% | 10.1% | 143,788 | 145,578 |
| Active Idle | 0 | 0 | |
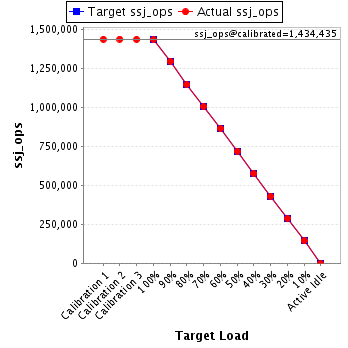
| Target Load | Actual Load | ssj_ops | |
|---|---|---|---|
| Target | Actual | ||
| Calibration 1 | 1,434,924 | ||
| Calibration 2 | 1,435,257 | ||
| Calibration 3 | 1,433,612 | ||
| ssj_ops@calibrated=1,434,435 | |||
| 100% | 99.9% | 1,434,435 | 1,432,546 |
| 90% | 90.2% | 1,290,991 | 1,294,052 |
| 80% | 79.8% | 1,147,548 | 1,144,724 |
| 70% | 70.0% | 1,004,104 | 1,004,625 |
| 60% | 60.2% | 860,661 | 864,105 |
| 50% | 50.1% | 717,217 | 718,218 |
| 40% | 40.0% | 573,774 | 573,579 |
| 30% | 30.0% | 430,330 | 430,029 |
| 20% | 20.0% | 286,887 | 286,773 |
| 10% | 10.0% | 143,443 | 143,946 |
| Active Idle | 0 | 0 | |
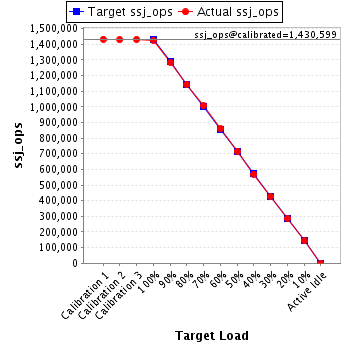
| Target Load | Actual Load | ssj_ops | |
|---|---|---|---|
| Target | Actual | ||
| Calibration 1 | 1,432,683 | ||
| Calibration 2 | 1,429,061 | ||
| Calibration 3 | 1,432,137 | ||
| ssj_ops@calibrated=1,430,599 | |||
| 100% | 99.7% | 1,430,599 | 1,426,984 |
| 90% | 89.8% | 1,287,539 | 1,284,189 |
| 80% | 79.9% | 1,144,479 | 1,142,642 |
| 70% | 70.3% | 1,001,420 | 1,005,867 |
| 60% | 60.0% | 858,360 | 858,641 |
| 50% | 50.0% | 715,300 | 715,089 |
| 40% | 39.9% | 572,240 | 570,492 |
| 30% | 29.8% | 429,180 | 427,032 |
| 20% | 20.1% | 286,120 | 287,836 |
| 10% | 10.0% | 143,060 | 143,579 |
| Active Idle | 0 | 0 | |