SPECpower_ssj2008
Host 'NODE11' Performance Report
Copyright © 2007-2019 Standard Performance Evaluation Corporation
| Hewlett Packard Enterprise Synergy 480 Gen10 Compute Module | ssj_ops@100% = 5,751,525 ssj_ops@100% per JVM = 1,437,881 |
||||
| Test Sponsor: | Hewlett Packard Enterprise | SPEC License #: | 3 | Test Method: | Multi Node |
| Tested By: | Hewlett Packard Enterprise | Test Location: | Houston, TX, USA | Test Date: | Mar 26, 2019 |
| Hardware Availability: | Apr-2019 | Software Availability: | Mar-2019 | Publication: | May 8, 2019 |
| System Source: | Single Supplier | System Designation: | Server | Power Provisioning: | Line-powered |
| Target Load | Actual Load | ssj_ops | |
|---|---|---|---|
| Target | Actual | ||
| Calibration 1 | 5,766,287 | ||
| Calibration 2 | 5,764,124 | ||
| Calibration 3 | 5,770,621 | ||
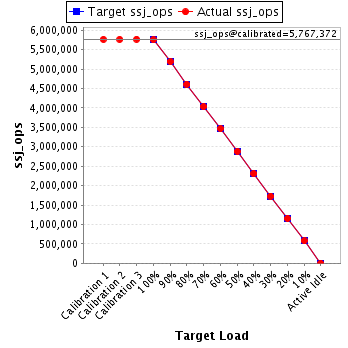
| ssj_ops@calibrated=5,767,372 | |||
| 100% | 99.7% | 5,767,372 | 5,751,525 |
| 90% | 90.0% | 5,190,635 | 5,193,479 |
| 80% | 79.9% | 4,613,898 | 4,609,686 |
| 70% | 69.9% | 4,037,161 | 4,032,536 |
| 60% | 60.1% | 3,460,423 | 3,463,789 |
| 50% | 50.0% | 2,883,686 | 2,881,237 |
| 40% | 40.0% | 2,306,949 | 2,305,705 |
| 30% | 30.0% | 1,730,212 | 1,730,867 |
| 20% | 20.0% | 1,153,474 | 1,152,930 |
| 10% | 10.0% | 576,737 | 577,391 |
| Active Idle | 0 | 0 | |
| Set Identifier: | SUT |
| Set Description: | System Under Test |
| # of Identical Nodes: | 11 |
| Comment: | SUT |
| Hardware | |
|---|---|
| Hardware Vendor: | Hewlett Packard Enterprise |
| Model: | Synergy 480 Gen10 Compute Module |
| Form Factor: | 7U |
| CPU Name: | Intel Xeon Platinum 8280 @ 2.70GHz (Intel Turbo Boost Technology up to 4.00 GHz) |
| CPU Characteristics: | 28-Core, 2.70 GHz, 38.5MB L3 Cache |
| CPU Frequency (MHz): | 2700 |
| CPU(s) Enabled: | 56 cores, 2 chips, 28 cores/chip |
| Hardware Threads: | 112 (2 / core) |
| CPU(s) Orderable: | 1,2 chips |
| Primary Cache: | 32 KB I + 32 KB D on chip per core |
| Secondary Cache: | 1 MB I+D on chip per core |
| Tertiary Cache: | 39424 KB I+D on chip per chip |
| Other Cache: | None |
| Memory Amount (GB): | 192 |
| # and size of DIMM: | 12 x 16384 MB |
| Memory Details: | 12 x 16GB 2Rx8 PC4-2933Y-R; slots 1, 3, 5, 8, 10 and 12 populated in each socket |
| Power Supply Quantity and Rating (W): | None |
| Power Supply Details: | N/A |
| Disk Drive: | 1 x HPE 240GB 6G SATA M.2 SSD (875488-B21) |
| Disk Controller: | HPE Smart Array S100i SR Gen10 |
| # and type of Network Interface Cards (NICs) Installed: | 1 x HPE Synergy 3820C 10/20Gb CNA |
| NICs Enabled in Firmware / OS / Connected: | 2/2/1 |
| Network Speed (Mbit): | 1000 |
| Keyboard: | None |
| Mouse: | None |
| Monitor: | None |
| Optical Drives: | No |
| Other Hardware: | H/S: Standard |
| Software | |
|---|---|
| Power Management: | Enabled (see SUT Notes) |
| Operating System (OS): | Windows Server 2012 R2 Datacenter |
| OS Version: | Version 6.3 (Build 9600) |
| Filesystem: | NTFS |
| JVM Vendor: | Oracle Corporation |
| JVM Version: | Oracle Java HotSpot(TM) 64-Bit Server VM (build 24.80-b11, mixed mode), version 1.7.0_80 |
| JVM Command-line Options: | -server -Xmn21000m -Xms24000m -Xmx24000m -XX:SurvivorRatio=1 -XX:TargetSurvivorRatio=99 -XX:AllocatePrefetchDistance=256 -XX:AllocatePrefetchLines=4 -XX:LoopUnrollLimit=45 -XX:InitialTenuringThreshold=12 -XX:MaxTenuringThreshold=15 -XX:ParallelGCThreads=28 -XX:InlineSmallCode=3900 -XX:MaxInlineSize=270 -XX:FreqInlineSize=2500 -XX:+AggressiveOpts -XX:+UseLargePages -XX:+UseParallelOldGC |
| JVM Affinity: | start /NODE [0,1,2,3] /AFFINITY [0xFFFFFFF] |
| JVM Instances: | 4 |
| JVM Initial Heap (MB): | 24000 |
| JVM Maximum Heap (MB): | 24000 |
| JVM Address Bits: | 64 |
| Boot Firmware Version: | I42 v2.00 (02/02/2019) |
| Management Firmware Version: | 1.40 Feb 05 2019 |
| Workload Version: | SSJ 1.2.10 |
| Director Location: | Controller |
| Other Software: | HPE Service Pack for ProLiant (SPP) Version: 2019.03.0, Microsoft Windows KB4056898, KB4338815 |
| JVM Instance | ssj_ops@100% |
|---|---|
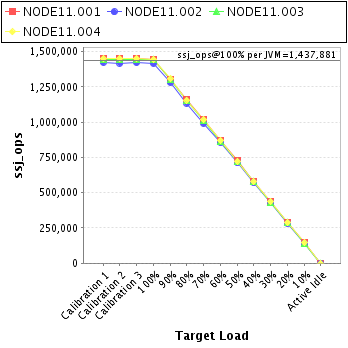
| NODE11.001 | 1,446,621 |
| NODE11.002 | 1,417,266 |
| NODE11.003 | 1,441,616 |
| NODE11.004 | 1,446,022 |
| ssj_ops@100% | 5,751,525 |
| ssj_ops@100% per JVM | 1,437,881 |
| Target Load | Actual Load | ssj_ops | |
|---|---|---|---|
| Target | Actual | ||
| Calibration 1 | 1,450,442 | ||
| Calibration 2 | 1,450,825 | ||
| Calibration 3 | 1,453,358 | ||
| ssj_ops@calibrated=1,452,092 | |||
| 100% | 99.6% | 1,452,092 | 1,446,621 |
| 90% | 89.9% | 1,306,882 | 1,305,154 |
| 80% | 80.0% | 1,161,673 | 1,162,304 |
| 70% | 69.9% | 1,016,464 | 1,015,693 |
| 60% | 60.1% | 871,255 | 872,325 |
| 50% | 50.1% | 726,046 | 727,611 |
| 40% | 40.0% | 580,837 | 580,406 |
| 30% | 30.0% | 435,627 | 435,828 |
| 20% | 20.1% | 290,418 | 291,505 |
| 10% | 10.1% | 145,209 | 146,018 |
| Active Idle | 0 | 0 | |

| Target Load | Actual Load | ssj_ops | |
|---|---|---|---|
| Target | Actual | ||
| Calibration 1 | 1,424,696 | ||
| Calibration 2 | 1,419,165 | ||
| Calibration 3 | 1,423,500 | ||
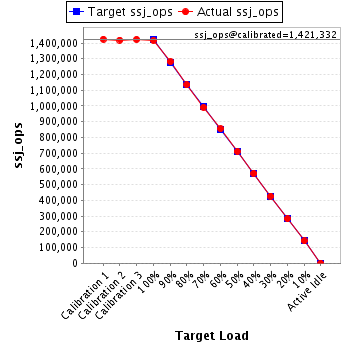
| ssj_ops@calibrated=1,421,332 | |||
| 100% | 99.7% | 1,421,332 | 1,417,266 |
| 90% | 90.2% | 1,279,199 | 1,282,191 |
| 80% | 79.9% | 1,137,066 | 1,135,006 |
| 70% | 69.8% | 994,933 | 991,934 |
| 60% | 60.2% | 852,799 | 855,350 |
| 50% | 50.0% | 710,666 | 711,372 |
| 40% | 40.2% | 568,533 | 570,747 |
| 30% | 30.1% | 426,400 | 427,277 |
| 20% | 19.9% | 284,266 | 282,406 |
| 10% | 10.0% | 142,133 | 142,062 |
| Active Idle | 0 | 0 | |
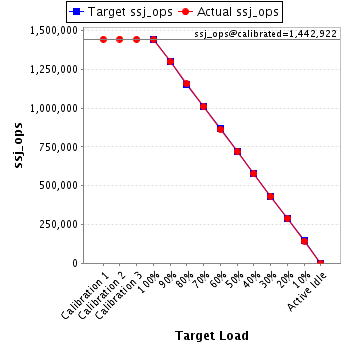
| Target Load | Actual Load | ssj_ops | |
|---|---|---|---|
| Target | Actual | ||
| Calibration 1 | 1,441,701 | ||
| Calibration 2 | 1,443,993 | ||
| Calibration 3 | 1,441,852 | ||
| ssj_ops@calibrated=1,442,922 | |||
| 100% | 99.9% | 1,442,922 | 1,441,616 |
| 90% | 90.0% | 1,298,630 | 1,298,752 |
| 80% | 80.1% | 1,154,338 | 1,155,582 |
| 70% | 69.9% | 1,010,046 | 1,009,006 |
| 60% | 59.9% | 865,753 | 864,435 |
| 50% | 49.8% | 721,461 | 718,992 |
| 40% | 39.9% | 577,169 | 576,137 |
| 30% | 29.9% | 432,877 | 431,726 |
| 20% | 20.1% | 288,584 | 289,902 |
| 10% | 9.9% | 144,292 | 143,144 |
| Active Idle | 0 | 0 | |
| Target Load | Actual Load | ssj_ops | |
|---|---|---|---|
| Target | Actual | ||
| Calibration 1 | 1,449,447 | ||
| Calibration 2 | 1,450,141 | ||
| Calibration 3 | 1,451,912 | ||
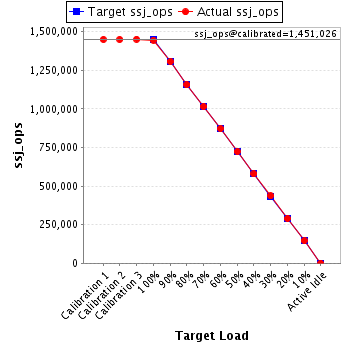
| ssj_ops@calibrated=1,451,026 | |||
| 100% | 99.7% | 1,451,026 | 1,446,022 |
| 90% | 90.1% | 1,305,924 | 1,307,382 |
| 80% | 79.7% | 1,160,821 | 1,156,794 |
| 70% | 70.0% | 1,015,719 | 1,015,904 |
| 60% | 60.1% | 870,616 | 871,679 |
| 50% | 49.8% | 725,513 | 723,262 |
| 40% | 39.9% | 580,411 | 578,416 |
| 30% | 30.1% | 435,308 | 436,036 |
| 20% | 19.9% | 290,205 | 289,117 |
| 10% | 10.1% | 145,103 | 146,167 |
| Active Idle | 0 | 0 | |