
SPECpower_ssj2008
Host 'NODE01' Performance Report
Copyright © 2007-2019 Standard Performance Evaluation Corporation
| Hewlett Packard Enterprise Synergy 480 Gen10 Compute Module | ssj_ops@100% = 5,780,151 ssj_ops@100% per JVM = 1,445,038 |
||||
| Test Sponsor: | Hewlett Packard Enterprise | SPEC License #: | 3 | Test Method: | Multi Node |
| Tested By: | Hewlett Packard Enterprise | Test Location: | Houston, TX, USA | Test Date: | Mar 26, 2019 |
| Hardware Availability: | Apr-2019 | Software Availability: | Mar-2019 | Publication: | May 8, 2019 |
| System Source: | Single Supplier | System Designation: | Server | Power Provisioning: | Line-powered |
| Target Load | Actual Load | ssj_ops | |
|---|---|---|---|
| Target | Actual | ||
| Calibration 1 | 5,785,044 | ||
| Calibration 2 | 5,789,322 | ||
| Calibration 3 | 5,799,717 | ||
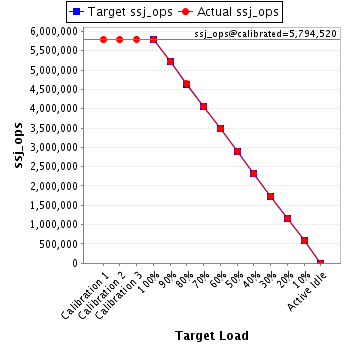
| ssj_ops@calibrated=5,794,520 | |||
| 100% | 99.8% | 5,794,520 | 5,780,151 |
| 90% | 90.1% | 5,215,068 | 5,218,414 |
| 80% | 80.1% | 4,635,616 | 4,639,854 |
| 70% | 70.0% | 4,056,164 | 4,055,200 |
| 60% | 60.0% | 3,476,712 | 3,479,386 |
| 50% | 50.1% | 2,897,260 | 2,901,418 |
| 40% | 40.0% | 2,317,808 | 2,320,433 |
| 30% | 30.0% | 1,738,356 | 1,739,631 |
| 20% | 20.0% | 1,158,904 | 1,158,046 |
| 10% | 10.0% | 579,452 | 580,242 |
| Active Idle | 0 | 0 | |
| Set Identifier: | SUT |
| Set Description: | System Under Test |
| # of Identical Nodes: | 10 |
| Comment: | SUT |
| Hardware | |
|---|---|
| Hardware Vendor: | Hewlett Packard Enterprise |
| Model: | Synergy 480 Gen10 Compute Module |
| Form Factor: | 7U |
| CPU Name: | Intel Xeon Platinum 8280 @ 2.70GHz (Intel Turbo Boost Technology up to 4.00 GHz) |
| CPU Characteristics: | 28-Core, 2.70 GHz, 38.5MB L3 Cache |
| CPU Frequency (MHz): | 2700 |
| CPU(s) Enabled: | 56 cores, 2 chips, 28 cores/chip |
| Hardware Threads: | 112 (2 / core) |
| CPU(s) Orderable: | 1,2 chips |
| Primary Cache: | 32 KB I + 32 KB D on chip per core |
| Secondary Cache: | 1 MB I+D on chip per core |
| Tertiary Cache: | 39424 KB I+D on chip per chip |
| Other Cache: | None |
| Memory Amount (GB): | 192 |
| # and size of DIMM: | 12 x 16384 MB |
| Memory Details: | 12 x 16GB 2Rx8 PC4-2933Y-R; slots 1, 3, 5, 8, 10 and 12 populated in each socket |
| Power Supply Quantity and Rating (W): | None |
| Power Supply Details: | N/A |
| Disk Drive: | 1 x HPE 240GB 6G SATA M.2 SSD (875488-B21) |
| Disk Controller: | HPE Smart Array S100i SR Gen10 |
| # and type of Network Interface Cards (NICs) Installed: | 1 x HPE Synergy 3820C 10/20Gb CNA |
| NICs Enabled in Firmware / OS / Connected: | 2/2/1 |
| Network Speed (Mbit): | 1000 |
| Keyboard: | None |
| Mouse: | None |
| Monitor: | None |
| Optical Drives: | No |
| Other Hardware: | H/S: Standard |
| Software | |
|---|---|
| Power Management: | Enabled (see SUT Notes) |
| Operating System (OS): | Windows Server 2012 R2 Datacenter |
| OS Version: | Version 6.3 (Build 9600) |
| Filesystem: | NTFS |
| JVM Vendor: | Oracle Corporation |
| JVM Version: | Oracle Java HotSpot(TM) 64-Bit Server VM (build 24.80-b11, mixed mode), version 1.7.0_80 |
| JVM Command-line Options: | -server -Xmn21000m -Xms24000m -Xmx24000m -XX:SurvivorRatio=1 -XX:TargetSurvivorRatio=99 -XX:AllocatePrefetchDistance=256 -XX:AllocatePrefetchLines=4 -XX:LoopUnrollLimit=45 -XX:InitialTenuringThreshold=12 -XX:MaxTenuringThreshold=15 -XX:ParallelGCThreads=28 -XX:InlineSmallCode=3900 -XX:MaxInlineSize=270 -XX:FreqInlineSize=2500 -XX:+AggressiveOpts -XX:+UseLargePages -XX:+UseParallelOldGC |
| JVM Affinity: | start /NODE [0,1,2,3] /AFFINITY [0xFFFFFFF] |
| JVM Instances: | 4 |
| JVM Initial Heap (MB): | 24000 |
| JVM Maximum Heap (MB): | 24000 |
| JVM Address Bits: | 64 |
| Boot Firmware Version: | I42 v2.00 (02/02/2019) |
| Management Firmware Version: | 1.40 Feb 05 2019 |
| Workload Version: | SSJ 1.2.10 |
| Director Location: | Controller |
| Other Software: | HPE Service Pack for ProLiant (SPP) Version: 2019.03.0, Microsoft Windows KB4056898, KB4338815 |
| JVM Instance | ssj_ops@100% |
|---|---|
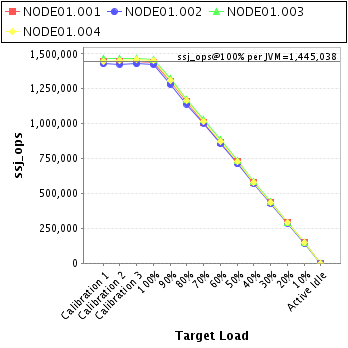
| NODE01.001 | 1,441,445 |
| NODE01.002 | 1,423,716 |
| NODE01.003 | 1,461,629 |
| NODE01.004 | 1,453,361 |
| ssj_ops@100% | 5,780,151 |
| ssj_ops@100% per JVM | 1,445,038 |
| Target Load | Actual Load | ssj_ops | |
|---|---|---|---|
| Target | Actual | ||
| Calibration 1 | 1,444,425 | ||
| Calibration 2 | 1,445,864 | ||
| Calibration 3 | 1,447,062 | ||
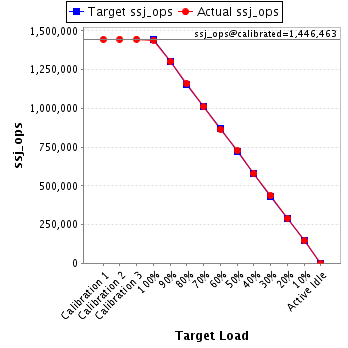
| ssj_ops@calibrated=1,446,463 | |||
| 100% | 99.7% | 1,446,463 | 1,441,445 |
| 90% | 90.0% | 1,301,816 | 1,301,711 |
| 80% | 80.2% | 1,157,170 | 1,159,936 |
| 70% | 69.9% | 1,012,524 | 1,010,620 |
| 60% | 59.9% | 867,878 | 865,997 |
| 50% | 50.2% | 723,231 | 726,163 |
| 40% | 40.0% | 578,585 | 579,219 |
| 30% | 30.1% | 433,939 | 435,578 |
| 20% | 20.1% | 289,293 | 290,213 |
| 10% | 10.0% | 144,646 | 145,354 |
| Active Idle | 0 | 0 | |
| Target Load | Actual Load | ssj_ops | |
|---|---|---|---|
| Target | Actual | ||
| Calibration 1 | 1,427,509 | ||
| Calibration 2 | 1,425,250 | ||
| Calibration 3 | 1,427,497 | ||
| ssj_ops@calibrated=1,426,374 | |||
| 100% | 99.8% | 1,426,374 | 1,423,716 |
| 90% | 89.9% | 1,283,736 | 1,281,711 |
| 80% | 79.9% | 1,141,099 | 1,140,173 |
| 70% | 70.3% | 998,461 | 1,002,064 |
| 60% | 60.0% | 855,824 | 855,659 |
| 50% | 49.9% | 713,187 | 712,029 |
| 40% | 40.0% | 570,549 | 570,680 |
| 30% | 30.0% | 427,912 | 428,475 |
| 20% | 20.0% | 285,275 | 284,949 |
| 10% | 10.0% | 142,637 | 143,298 |
| Active Idle | 0 | 0 | |

| Target Load | Actual Load | ssj_ops | |
|---|---|---|---|
| Target | Actual | ||
| Calibration 1 | 1,467,800 | ||
| Calibration 2 | 1,467,066 | ||
| Calibration 3 | 1,468,911 | ||
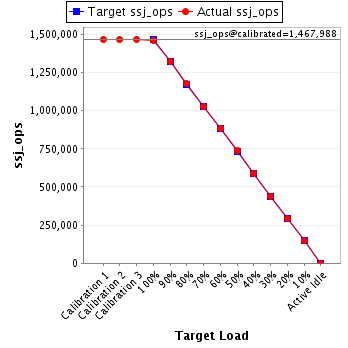
| ssj_ops@calibrated=1,467,988 | |||
| 100% | 99.6% | 1,467,988 | 1,461,629 |
| 90% | 90.1% | 1,321,189 | 1,323,050 |
| 80% | 80.1% | 1,174,391 | 1,175,918 |
| 70% | 69.9% | 1,027,592 | 1,026,711 |
| 60% | 60.2% | 880,793 | 883,796 |
| 50% | 50.2% | 733,994 | 736,257 |
| 40% | 40.1% | 587,195 | 588,499 |
| 30% | 30.0% | 440,396 | 440,391 |
| 20% | 19.9% | 293,598 | 291,834 |
| 10% | 10.0% | 146,799 | 146,242 |
| Active Idle | 0 | 0 | |
| Target Load | Actual Load | ssj_ops | |
|---|---|---|---|
| Target | Actual | ||
| Calibration 1 | 1,445,310 | ||
| Calibration 2 | 1,451,143 | ||
| Calibration 3 | 1,456,247 | ||
| ssj_ops@calibrated=1,453,695 | |||
| 100% | 100.0% | 1,453,695 | 1,453,361 |
| 90% | 90.2% | 1,308,326 | 1,311,942 |
| 80% | 80.1% | 1,162,956 | 1,163,826 |
| 70% | 69.9% | 1,017,587 | 1,015,805 |
| 60% | 60.1% | 872,217 | 873,934 |
| 50% | 50.0% | 726,848 | 726,969 |
| 40% | 40.0% | 581,478 | 582,035 |
| 30% | 29.9% | 436,109 | 435,188 |
| 20% | 20.0% | 290,739 | 291,050 |
| 10% | 10.0% | 145,370 | 145,348 |
| Active Idle | 0 | 0 | |
