SPECpower_ssj2008
Host 'NODE02' Performance Report
Copyright © 2007-2019 Standard Performance Evaluation Corporation
| Hewlett Packard Enterprise Synergy 480 Gen10 Compute Module | ssj_ops@100% = 5,752,087 ssj_ops@100% per JVM = 1,438,022 |
||||
| Test Sponsor: | Hewlett Packard Enterprise | SPEC License #: | 3 | Test Method: | Multi Node |
| Tested By: | Hewlett Packard Enterprise | Test Location: | Houston, TX, USA | Test Date: | Mar 26, 2019 |
| Hardware Availability: | Apr-2019 | Software Availability: | Mar-2019 | Publication: | May 8, 2019 |
| System Source: | Single Supplier | System Designation: | Server | Power Provisioning: | Line-powered |
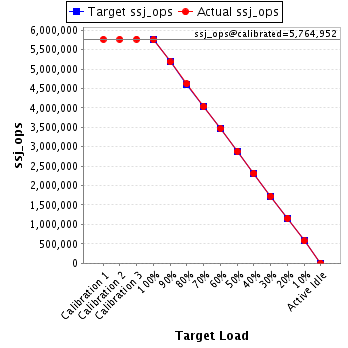
| Target Load | Actual Load | ssj_ops | |
|---|---|---|---|
| Target | Actual | ||
| Calibration 1 | 5,763,911 | ||
| Calibration 2 | 5,761,857 | ||
| Calibration 3 | 5,768,047 | ||
| ssj_ops@calibrated=5,764,952 | |||
| 100% | 99.8% | 5,764,952 | 5,752,087 |
| 90% | 89.9% | 5,188,457 | 5,183,199 |
| 80% | 80.2% | 4,611,961 | 4,621,573 |
| 70% | 70.0% | 4,035,466 | 4,035,249 |
| 60% | 60.1% | 3,458,971 | 3,464,368 |
| 50% | 50.0% | 2,882,476 | 2,880,214 |
| 40% | 40.1% | 2,305,981 | 2,311,832 |
| 30% | 30.0% | 1,729,486 | 1,728,309 |
| 20% | 20.1% | 1,152,990 | 1,158,336 |
| 10% | 10.0% | 576,495 | 575,608 |
| Active Idle | 0 | 0 | |
| Set Identifier: | SUT |
| Set Description: | System Under Test |
| # of Identical Nodes: | 10 |
| Comment: | SUT |
| Hardware | |
|---|---|
| Hardware Vendor: | Hewlett Packard Enterprise |
| Model: | Synergy 480 Gen10 Compute Module |
| Form Factor: | 7U |
| CPU Name: | Intel Xeon Platinum 8280 @ 2.70GHz (Intel Turbo Boost Technology up to 4.00 GHz) |
| CPU Characteristics: | 28-Core, 2.70 GHz, 38.5MB L3 Cache |
| CPU Frequency (MHz): | 2700 |
| CPU(s) Enabled: | 56 cores, 2 chips, 28 cores/chip |
| Hardware Threads: | 112 (2 / core) |
| CPU(s) Orderable: | 1,2 chips |
| Primary Cache: | 32 KB I + 32 KB D on chip per core |
| Secondary Cache: | 1 MB I+D on chip per core |
| Tertiary Cache: | 39424 KB I+D on chip per chip |
| Other Cache: | None |
| Memory Amount (GB): | 192 |
| # and size of DIMM: | 12 x 16384 MB |
| Memory Details: | 12 x 16GB 2Rx8 PC4-2933Y-R; slots 1, 3, 5, 8, 10 and 12 populated in each socket |
| Power Supply Quantity and Rating (W): | None |
| Power Supply Details: | N/A |
| Disk Drive: | 1 x HPE 240GB 6G SATA M.2 SSD (875488-B21) |
| Disk Controller: | HPE Smart Array S100i SR Gen10 |
| # and type of Network Interface Cards (NICs) Installed: | 1 x HPE Synergy 3820C 10/20Gb CNA |
| NICs Enabled in Firmware / OS / Connected: | 2/2/1 |
| Network Speed (Mbit): | 1000 |
| Keyboard: | None |
| Mouse: | None |
| Monitor: | None |
| Optical Drives: | No |
| Other Hardware: | H/S: Standard |
| Software | |
|---|---|
| Power Management: | Enabled (see SUT Notes) |
| Operating System (OS): | Windows Server 2012 R2 Datacenter |
| OS Version: | Version 6.3 (Build 9600) |
| Filesystem: | NTFS |
| JVM Vendor: | Oracle Corporation |
| JVM Version: | Oracle Java HotSpot(TM) 64-Bit Server VM (build 24.80-b11, mixed mode), version 1.7.0_80 |
| JVM Command-line Options: | -server -Xmn21000m -Xms24000m -Xmx24000m -XX:SurvivorRatio=1 -XX:TargetSurvivorRatio=99 -XX:AllocatePrefetchDistance=256 -XX:AllocatePrefetchLines=4 -XX:LoopUnrollLimit=45 -XX:InitialTenuringThreshold=12 -XX:MaxTenuringThreshold=15 -XX:ParallelGCThreads=28 -XX:InlineSmallCode=3900 -XX:MaxInlineSize=270 -XX:FreqInlineSize=2500 -XX:+AggressiveOpts -XX:+UseLargePages -XX:+UseParallelOldGC |
| JVM Affinity: | start /NODE [0,1,2,3] /AFFINITY [0xFFFFFFF] |
| JVM Instances: | 4 |
| JVM Initial Heap (MB): | 24000 |
| JVM Maximum Heap (MB): | 24000 |
| JVM Address Bits: | 64 |
| Boot Firmware Version: | I42 v2.00 (02/02/2019) |
| Management Firmware Version: | 1.40 Feb 05 2019 |
| Workload Version: | SSJ 1.2.10 |
| Director Location: | Controller |
| Other Software: | HPE Service Pack for ProLiant (SPP) Version: 2019.03.0, Microsoft Windows KB4056898, KB4338815 |
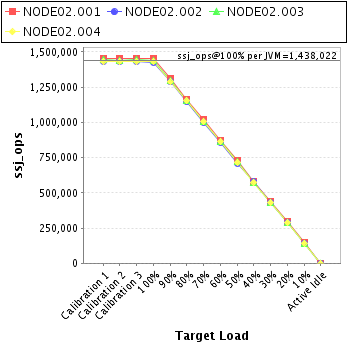
| JVM Instance | ssj_ops@100% |
|---|---|
| NODE02.001 | 1,450,746 |
| NODE02.002 | 1,427,903 |
| NODE02.003 | 1,438,731 |
| NODE02.004 | 1,434,707 |
| ssj_ops@100% | 5,752,087 |
| ssj_ops@100% per JVM | 1,438,022 |
| Target Load | Actual Load | ssj_ops | |
|---|---|---|---|
| Target | Actual | ||
| Calibration 1 | 1,451,054 | ||
| Calibration 2 | 1,455,780 | ||
| Calibration 3 | 1,455,602 | ||
| ssj_ops@calibrated=1,455,691 | |||
| 100% | 99.7% | 1,455,691 | 1,450,746 |
| 90% | 90.1% | 1,310,122 | 1,311,707 |
| 80% | 80.0% | 1,164,553 | 1,164,998 |
| 70% | 70.0% | 1,018,984 | 1,018,760 |
| 60% | 60.1% | 873,415 | 874,867 |
| 50% | 50.0% | 727,846 | 728,246 |
| 40% | 40.1% | 582,276 | 583,548 |
| 30% | 30.0% | 436,707 | 436,221 |
| 20% | 20.2% | 291,138 | 293,829 |
| 10% | 10.0% | 145,569 | 145,300 |
| Active Idle | 0 | 0 | |

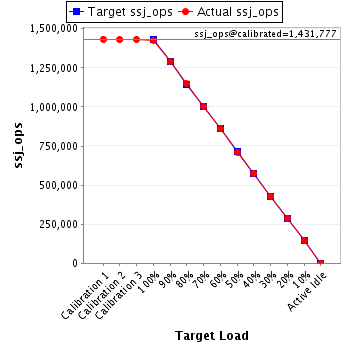
| Target Load | Actual Load | ssj_ops | |
|---|---|---|---|
| Target | Actual | ||
| Calibration 1 | 1,433,285 | ||
| Calibration 2 | 1,430,912 | ||
| Calibration 3 | 1,432,642 | ||
| ssj_ops@calibrated=1,431,777 | |||
| 100% | 99.7% | 1,431,777 | 1,427,903 |
| 90% | 89.9% | 1,288,599 | 1,287,875 |
| 80% | 80.1% | 1,145,421 | 1,146,808 |
| 70% | 69.9% | 1,002,244 | 1,000,101 |
| 60% | 60.0% | 859,066 | 859,207 |
| 50% | 49.7% | 715,888 | 711,118 |
| 40% | 40.3% | 572,711 | 576,886 |
| 30% | 30.0% | 429,533 | 429,183 |
| 20% | 20.2% | 286,355 | 289,334 |
| 10% | 10.0% | 143,178 | 143,803 |
| Active Idle | 0 | 0 | |
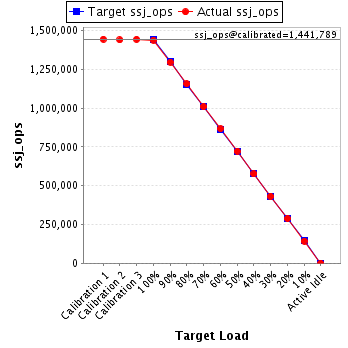
| Target Load | Actual Load | ssj_ops | |
|---|---|---|---|
| Target | Actual | ||
| Calibration 1 | 1,444,479 | ||
| Calibration 2 | 1,439,470 | ||
| Calibration 3 | 1,444,107 | ||
| ssj_ops@calibrated=1,441,789 | |||
| 100% | 99.8% | 1,441,789 | 1,438,731 |
| 90% | 89.9% | 1,297,610 | 1,296,541 |
| 80% | 80.2% | 1,153,431 | 1,156,882 |
| 70% | 70.0% | 1,009,252 | 1,009,703 |
| 60% | 60.1% | 865,073 | 867,191 |
| 50% | 50.2% | 720,894 | 723,091 |
| 40% | 39.9% | 576,716 | 575,710 |
| 30% | 30.0% | 432,537 | 432,326 |
| 20% | 20.0% | 288,358 | 287,919 |
| 10% | 9.9% | 144,179 | 143,021 |
| Active Idle | 0 | 0 | |
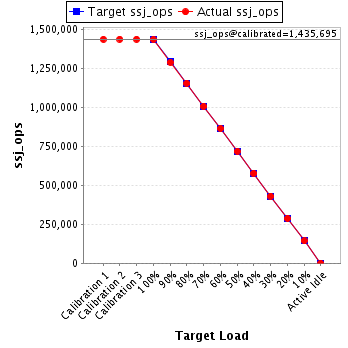
| Target Load | Actual Load | ssj_ops | |
|---|---|---|---|
| Target | Actual | ||
| Calibration 1 | 1,435,092 | ||
| Calibration 2 | 1,435,695 | ||
| Calibration 3 | 1,435,696 | ||
| ssj_ops@calibrated=1,435,695 | |||
| 100% | 99.9% | 1,435,695 | 1,434,707 |
| 90% | 89.6% | 1,292,126 | 1,287,075 |
| 80% | 80.3% | 1,148,556 | 1,152,885 |
| 70% | 70.1% | 1,004,987 | 1,006,685 |
| 60% | 60.1% | 861,417 | 863,103 |
| 50% | 50.0% | 717,848 | 717,759 |
| 40% | 40.1% | 574,278 | 575,687 |
| 30% | 30.0% | 430,709 | 430,579 |
| 20% | 20.0% | 287,139 | 287,254 |
| 10% | 10.0% | 143,570 | 143,484 |
| Active Idle | 0 | 0 | |