SPECpower_ssj2008
Host 'NODE03' Performance Report
Copyright © 2007-2019 Standard Performance Evaluation Corporation
| Hewlett Packard Enterprise Synergy 480 Gen10 Compute Module | ssj_ops@100% = 5,728,678 ssj_ops@100% per JVM = 1,432,169 |
||||
| Test Sponsor: | Hewlett Packard Enterprise | SPEC License #: | 3 | Test Method: | Multi Node |
| Tested By: | Hewlett Packard Enterprise | Test Location: | Houston, TX, USA | Test Date: | Mar 26, 2019 |
| Hardware Availability: | Apr-2019 | Software Availability: | Mar-2019 | Publication: | May 8, 2019 |
| System Source: | Single Supplier | System Designation: | Server | Power Provisioning: | Line-powered |
| Target Load | Actual Load | ssj_ops | |
|---|---|---|---|
| Target | Actual | ||
| Calibration 1 | 5,753,727 | ||
| Calibration 2 | 5,746,952 | ||
| Calibration 3 | 5,749,398 | ||
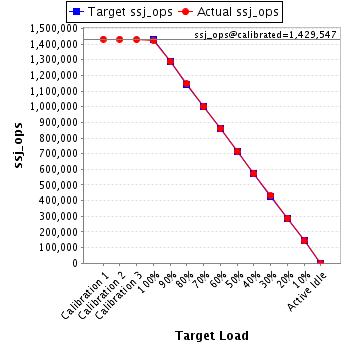
| ssj_ops@calibrated=5,748,175 | |||
| 100% | 99.7% | 5,748,175 | 5,728,678 |
| 90% | 90.0% | 5,173,357 | 5,172,959 |
| 80% | 80.1% | 4,598,540 | 4,604,802 |
| 70% | 70.1% | 4,023,722 | 4,029,112 |
| 60% | 60.0% | 3,448,905 | 3,451,542 |
| 50% | 50.0% | 2,874,087 | 2,876,740 |
| 40% | 39.9% | 2,299,270 | 2,296,006 |
| 30% | 30.0% | 1,724,452 | 1,725,557 |
| 20% | 20.0% | 1,149,635 | 1,149,712 |
| 10% | 10.0% | 574,817 | 575,386 |
| Active Idle | 0 | 0 | |
| Set Identifier: | SUT |
| Set Description: | System Under Test |
| # of Identical Nodes: | 10 |
| Comment: | SUT |
| Hardware | |
|---|---|
| Hardware Vendor: | Hewlett Packard Enterprise |
| Model: | Synergy 480 Gen10 Compute Module |
| Form Factor: | 7U |
| CPU Name: | Intel Xeon Platinum 8280 @ 2.70GHz (Intel Turbo Boost Technology up to 4.00 GHz) |
| CPU Characteristics: | 28-Core, 2.70 GHz, 38.5MB L3 Cache |
| CPU Frequency (MHz): | 2700 |
| CPU(s) Enabled: | 56 cores, 2 chips, 28 cores/chip |
| Hardware Threads: | 112 (2 / core) |
| CPU(s) Orderable: | 1,2 chips |
| Primary Cache: | 32 KB I + 32 KB D on chip per core |
| Secondary Cache: | 1 MB I+D on chip per core |
| Tertiary Cache: | 39424 KB I+D on chip per chip |
| Other Cache: | None |
| Memory Amount (GB): | 192 |
| # and size of DIMM: | 12 x 16384 MB |
| Memory Details: | 12 x 16GB 2Rx8 PC4-2933Y-R; slots 1, 3, 5, 8, 10 and 12 populated in each socket |
| Power Supply Quantity and Rating (W): | None |
| Power Supply Details: | N/A |
| Disk Drive: | 1 x HPE 240GB 6G SATA M.2 SSD (875488-B21) |
| Disk Controller: | HPE Smart Array S100i SR Gen10 |
| # and type of Network Interface Cards (NICs) Installed: | 1 x HPE Synergy 3820C 10/20Gb CNA |
| NICs Enabled in Firmware / OS / Connected: | 2/2/1 |
| Network Speed (Mbit): | 1000 |
| Keyboard: | None |
| Mouse: | None |
| Monitor: | None |
| Optical Drives: | No |
| Other Hardware: | H/S: Standard |
| Software | |
|---|---|
| Power Management: | Enabled (see SUT Notes) |
| Operating System (OS): | Windows Server 2012 R2 Datacenter |
| OS Version: | Version 6.3 (Build 9600) |
| Filesystem: | NTFS |
| JVM Vendor: | Oracle Corporation |
| JVM Version: | Oracle Java HotSpot(TM) 64-Bit Server VM (build 24.80-b11, mixed mode), version 1.7.0_80 |
| JVM Command-line Options: | -server -Xmn21000m -Xms24000m -Xmx24000m -XX:SurvivorRatio=1 -XX:TargetSurvivorRatio=99 -XX:AllocatePrefetchDistance=256 -XX:AllocatePrefetchLines=4 -XX:LoopUnrollLimit=45 -XX:InitialTenuringThreshold=12 -XX:MaxTenuringThreshold=15 -XX:ParallelGCThreads=28 -XX:InlineSmallCode=3900 -XX:MaxInlineSize=270 -XX:FreqInlineSize=2500 -XX:+AggressiveOpts -XX:+UseLargePages -XX:+UseParallelOldGC |
| JVM Affinity: | start /NODE [0,1,2,3] /AFFINITY [0xFFFFFFF] |
| JVM Instances: | 4 |
| JVM Initial Heap (MB): | 24000 |
| JVM Maximum Heap (MB): | 24000 |
| JVM Address Bits: | 64 |
| Boot Firmware Version: | I42 v2.00 (02/02/2019) |
| Management Firmware Version: | 1.40 Feb 05 2019 |
| Workload Version: | SSJ 1.2.10 |
| Director Location: | Controller |
| Other Software: | HPE Service Pack for ProLiant (SPP) Version: 2019.03.0, Microsoft Windows KB4056898, KB4338815 |
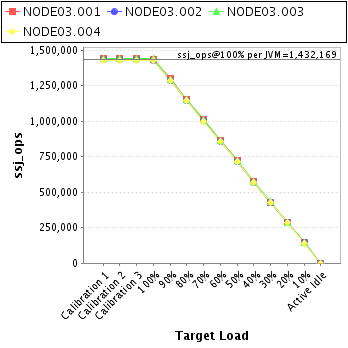
| JVM Instance | ssj_ops@100% |
|---|---|
| NODE03.001 | 1,435,768 |
| NODE03.002 | 1,428,416 |
| NODE03.003 | 1,439,533 |
| NODE03.004 | 1,424,961 |
| ssj_ops@100% | 5,728,678 |
| ssj_ops@100% per JVM | 1,432,169 |
| Target Load | Actual Load | ssj_ops | |
|---|---|---|---|
| Target | Actual | ||
| Calibration 1 | 1,442,996 | ||
| Calibration 2 | 1,439,965 | ||
| Calibration 3 | 1,441,617 | ||
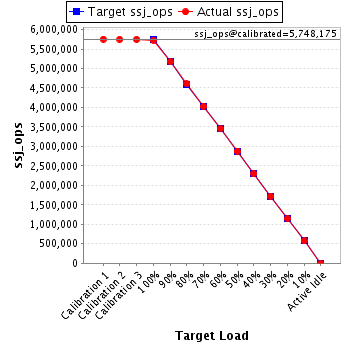
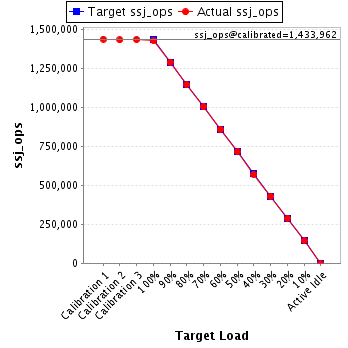
| ssj_ops@calibrated=1,440,791 | |||
| 100% | 99.7% | 1,440,791 | 1,435,768 |
| 90% | 90.1% | 1,296,712 | 1,298,216 |
| 80% | 80.3% | 1,152,633 | 1,156,839 |
| 70% | 70.2% | 1,008,554 | 1,010,839 |
| 60% | 60.1% | 864,475 | 866,148 |
| 50% | 50.1% | 720,396 | 722,051 |
| 40% | 40.0% | 576,316 | 575,963 |
| 30% | 29.9% | 432,237 | 430,802 |
| 20% | 20.0% | 288,158 | 288,113 |
| 10% | 10.0% | 144,079 | 143,466 |
| Active Idle | 0 | 0 | |
| Target Load | Actual Load | ssj_ops | |
|---|---|---|---|
| Target | Actual | ||
| Calibration 1 | 1,437,918 | ||
| Calibration 2 | 1,433,113 | ||
| Calibration 3 | 1,434,810 | ||
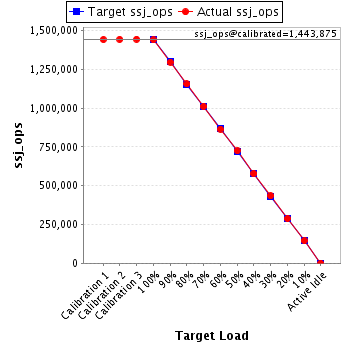
| ssj_ops@calibrated=1,433,962 | |||
| 100% | 99.6% | 1,433,962 | 1,428,416 |
| 90% | 90.0% | 1,290,565 | 1,290,746 |
| 80% | 80.0% | 1,147,169 | 1,146,924 |
| 70% | 70.1% | 1,003,773 | 1,005,733 |
| 60% | 60.0% | 860,377 | 860,387 |
| 50% | 49.9% | 716,981 | 715,444 |
| 40% | 39.9% | 573,585 | 571,660 |
| 30% | 30.1% | 430,188 | 431,138 |
| 20% | 20.1% | 286,792 | 287,610 |
| 10% | 10.1% | 143,396 | 144,180 |
| Active Idle | 0 | 0 | |
| Target Load | Actual Load | ssj_ops | |
|---|---|---|---|
| Target | Actual | ||
| Calibration 1 | 1,441,593 | ||
| Calibration 2 | 1,443,125 | ||
| Calibration 3 | 1,444,625 | ||
| ssj_ops@calibrated=1,443,875 | |||
| 100% | 99.7% | 1,443,875 | 1,439,533 |
| 90% | 89.8% | 1,299,488 | 1,296,741 |
| 80% | 80.0% | 1,155,100 | 1,155,673 |
| 70% | 70.1% | 1,010,713 | 1,012,435 |
| 60% | 59.9% | 866,325 | 865,295 |
| 50% | 50.2% | 721,938 | 724,198 |
| 40% | 39.9% | 577,550 | 576,809 |
| 30% | 30.0% | 433,163 | 433,811 |
| 20% | 19.9% | 288,775 | 287,237 |
| 10% | 10.0% | 144,388 | 145,072 |
| Active Idle | 0 | 0 | |
| Target Load | Actual Load | ssj_ops | |
|---|---|---|---|
| Target | Actual | ||
| Calibration 1 | 1,431,219 | ||
| Calibration 2 | 1,430,748 | ||
| Calibration 3 | 1,428,345 | ||
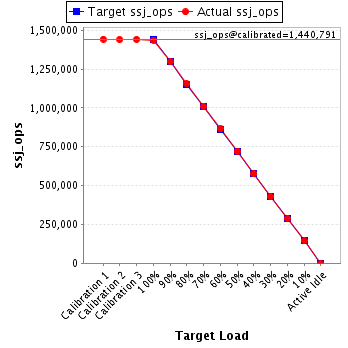
| ssj_ops@calibrated=1,429,547 | |||
| 100% | 99.7% | 1,429,547 | 1,424,961 |
| 90% | 90.0% | 1,286,592 | 1,287,256 |
| 80% | 80.1% | 1,143,637 | 1,145,366 |
| 70% | 70.0% | 1,000,683 | 1,000,105 |
| 60% | 60.1% | 857,728 | 859,713 |
| 50% | 50.0% | 714,773 | 715,047 |
| 40% | 40.0% | 571,819 | 571,574 |
| 30% | 30.1% | 428,864 | 429,805 |
| 20% | 20.1% | 285,909 | 286,752 |
| 10% | 10.0% | 142,955 | 142,669 |
| Active Idle | 0 | 0 | |