
SPECpower_ssj2008
Host 'NODE04' Performance Report
Copyright © 2007-2019 Standard Performance Evaluation Corporation
| Hewlett Packard Enterprise Synergy 480 Gen10 Compute Module | ssj_ops@100% = 5,774,487 ssj_ops@100% per JVM = 1,443,622 |
||||
| Test Sponsor: | Hewlett Packard Enterprise | SPEC License #: | 3 | Test Method: | Multi Node |
| Tested By: | Hewlett Packard Enterprise | Test Location: | Houston, TX, USA | Test Date: | Mar 26, 2019 |
| Hardware Availability: | Apr-2019 | Software Availability: | Mar-2019 | Publication: | May 8, 2019 |
| System Source: | Single Supplier | System Designation: | Server | Power Provisioning: | Line-powered |
| Target Load | Actual Load | ssj_ops | |
|---|---|---|---|
| Target | Actual | ||
| Calibration 1 | 5,797,422 | ||
| Calibration 2 | 5,787,131 | ||
| Calibration 3 | 5,795,907 | ||
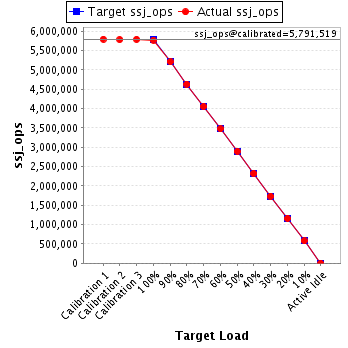
| ssj_ops@calibrated=5,791,519 | |||
| 100% | 99.7% | 5,791,519 | 5,774,487 |
| 90% | 90.0% | 5,212,367 | 5,213,967 |
| 80% | 80.0% | 4,633,215 | 4,634,701 |
| 70% | 70.1% | 4,054,063 | 4,059,191 |
| 60% | 60.0% | 3,474,911 | 3,474,611 |
| 50% | 50.0% | 2,895,760 | 2,896,255 |
| 40% | 40.0% | 2,316,608 | 2,318,390 |
| 30% | 30.0% | 1,737,456 | 1,736,475 |
| 20% | 20.1% | 1,158,304 | 1,161,717 |
| 10% | 10.0% | 579,152 | 577,761 |
| Active Idle | 0 | 0 | |
| Set Identifier: | SUT |
| Set Description: | System Under Test |
| # of Identical Nodes: | 10 |
| Comment: | SUT |
| Hardware | |
|---|---|
| Hardware Vendor: | Hewlett Packard Enterprise |
| Model: | Synergy 480 Gen10 Compute Module |
| Form Factor: | 7U |
| CPU Name: | Intel Xeon Platinum 8280 @ 2.70GHz (Intel Turbo Boost Technology up to 4.00 GHz) |
| CPU Characteristics: | 28-Core, 2.70 GHz, 38.5MB L3 Cache |
| CPU Frequency (MHz): | 2700 |
| CPU(s) Enabled: | 56 cores, 2 chips, 28 cores/chip |
| Hardware Threads: | 112 (2 / core) |
| CPU(s) Orderable: | 1,2 chips |
| Primary Cache: | 32 KB I + 32 KB D on chip per core |
| Secondary Cache: | 1 MB I+D on chip per core |
| Tertiary Cache: | 39424 KB I+D on chip per chip |
| Other Cache: | None |
| Memory Amount (GB): | 192 |
| # and size of DIMM: | 12 x 16384 MB |
| Memory Details: | 12 x 16GB 2Rx8 PC4-2933Y-R; slots 1, 3, 5, 8, 10 and 12 populated in each socket |
| Power Supply Quantity and Rating (W): | None |
| Power Supply Details: | N/A |
| Disk Drive: | 1 x HPE 240GB 6G SATA M.2 SSD (875488-B21) |
| Disk Controller: | HPE Smart Array S100i SR Gen10 |
| # and type of Network Interface Cards (NICs) Installed: | 1 x HPE Synergy 3820C 10/20Gb CNA |
| NICs Enabled in Firmware / OS / Connected: | 2/2/1 |
| Network Speed (Mbit): | 1000 |
| Keyboard: | None |
| Mouse: | None |
| Monitor: | None |
| Optical Drives: | No |
| Other Hardware: | H/S: Standard |
| Software | |
|---|---|
| Power Management: | Enabled (see SUT Notes) |
| Operating System (OS): | Windows Server 2012 R2 Datacenter |
| OS Version: | Version 6.3 (Build 9600) |
| Filesystem: | NTFS |
| JVM Vendor: | Oracle Corporation |
| JVM Version: | Oracle Java HotSpot(TM) 64-Bit Server VM (build 24.80-b11, mixed mode), version 1.7.0_80 |
| JVM Command-line Options: | -server -Xmn21000m -Xms24000m -Xmx24000m -XX:SurvivorRatio=1 -XX:TargetSurvivorRatio=99 -XX:AllocatePrefetchDistance=256 -XX:AllocatePrefetchLines=4 -XX:LoopUnrollLimit=45 -XX:InitialTenuringThreshold=12 -XX:MaxTenuringThreshold=15 -XX:ParallelGCThreads=28 -XX:InlineSmallCode=3900 -XX:MaxInlineSize=270 -XX:FreqInlineSize=2500 -XX:+AggressiveOpts -XX:+UseLargePages -XX:+UseParallelOldGC |
| JVM Affinity: | start /NODE [0,1,2,3] /AFFINITY [0xFFFFFFF] |
| JVM Instances: | 4 |
| JVM Initial Heap (MB): | 24000 |
| JVM Maximum Heap (MB): | 24000 |
| JVM Address Bits: | 64 |
| Boot Firmware Version: | I42 v2.00 (02/02/2019) |
| Management Firmware Version: | 1.40 Feb 05 2019 |
| Workload Version: | SSJ 1.2.10 |
| Director Location: | Controller |
| Other Software: | HPE Service Pack for ProLiant (SPP) Version: 2019.03.0, Microsoft Windows KB4056898, KB4338815 |
| JVM Instance | ssj_ops@100% |
|---|---|
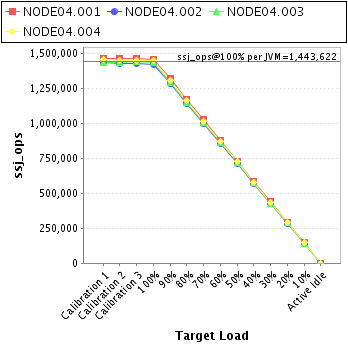
| NODE04.001 | 1,462,011 |
| NODE04.002 | 1,425,749 |
| NODE04.003 | 1,436,187 |
| NODE04.004 | 1,450,541 |
| ssj_ops@100% | 5,774,487 |
| ssj_ops@100% per JVM | 1,443,622 |
| Target Load | Actual Load | ssj_ops | |
|---|---|---|---|
| Target | Actual | ||
| Calibration 1 | 1,467,861 | ||
| Calibration 2 | 1,467,292 | ||
| Calibration 3 | 1,468,081 | ||
| ssj_ops@calibrated=1,467,687 | |||
| 100% | 99.6% | 1,467,687 | 1,462,011 |
| 90% | 90.2% | 1,320,918 | 1,323,180 |
| 80% | 80.0% | 1,174,149 | 1,173,438 |
| 70% | 70.2% | 1,027,381 | 1,029,702 |
| 60% | 59.9% | 880,612 | 879,277 |
| 50% | 49.9% | 733,843 | 731,647 |
| 40% | 40.0% | 587,075 | 587,770 |
| 30% | 30.0% | 440,306 | 440,484 |
| 20% | 20.1% | 293,537 | 294,870 |
| 10% | 10.1% | 146,769 | 148,030 |
| Active Idle | 0 | 0 | |

| Target Load | Actual Load | ssj_ops | |
|---|---|---|---|
| Target | Actual | ||
| Calibration 1 | 1,434,912 | ||
| Calibration 2 | 1,429,780 | ||
| Calibration 3 | 1,431,837 | ||
| ssj_ops@calibrated=1,430,808 | |||
| 100% | 99.6% | 1,430,808 | 1,425,749 |
| 90% | 89.8% | 1,287,728 | 1,285,076 |
| 80% | 80.0% | 1,144,647 | 1,144,493 |
| 70% | 70.1% | 1,001,566 | 1,002,821 |
| 60% | 59.8% | 858,485 | 856,307 |
| 50% | 50.1% | 715,404 | 716,824 |
| 40% | 40.0% | 572,323 | 572,308 |
| 30% | 30.0% | 429,243 | 429,701 |
| 20% | 20.0% | 286,162 | 285,892 |
| 10% | 9.9% | 143,081 | 141,631 |
| Active Idle | 0 | 0 | |

| Target Load | Actual Load | ssj_ops | |
|---|---|---|---|
| Target | Actual | ||
| Calibration 1 | 1,438,832 | ||
| Calibration 2 | 1,437,035 | ||
| Calibration 3 | 1,441,001 | ||
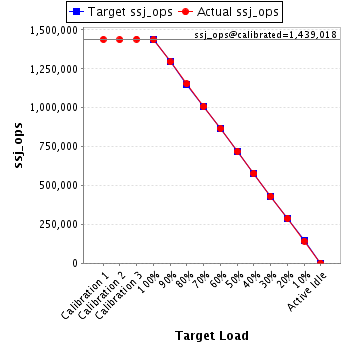
| ssj_ops@calibrated=1,439,018 | |||
| 100% | 99.8% | 1,439,018 | 1,436,187 |
| 90% | 90.0% | 1,295,116 | 1,295,283 |
| 80% | 80.2% | 1,151,214 | 1,153,771 |
| 70% | 70.1% | 1,007,313 | 1,008,968 |
| 60% | 60.2% | 863,411 | 865,803 |
| 50% | 50.0% | 719,509 | 718,961 |
| 40% | 40.1% | 575,607 | 576,617 |
| 30% | 29.9% | 431,705 | 430,640 |
| 20% | 20.1% | 287,804 | 288,529 |
| 10% | 9.9% | 143,902 | 142,542 |
| Active Idle | 0 | 0 | |
| Target Load | Actual Load | ssj_ops | |
|---|---|---|---|
| Target | Actual | ||
| Calibration 1 | 1,455,817 | ||
| Calibration 2 | 1,453,025 | ||
| Calibration 3 | 1,454,987 | ||
| ssj_ops@calibrated=1,454,006 | |||
| 100% | 99.8% | 1,454,006 | 1,450,541 |
| 90% | 90.1% | 1,308,605 | 1,310,428 |
| 80% | 80.0% | 1,163,205 | 1,162,999 |
| 70% | 70.0% | 1,017,804 | 1,017,700 |
| 60% | 60.1% | 872,404 | 873,224 |
| 50% | 50.1% | 727,003 | 728,823 |
| 40% | 40.0% | 581,602 | 581,694 |
| 30% | 30.0% | 436,202 | 435,650 |
| 20% | 20.1% | 290,801 | 292,426 |
| 10% | 10.0% | 145,401 | 145,559 |
| Active Idle | 0 | 0 | |
